


 190
190
In the face of an ongoing lawsuit, Ripple, the cross-border remittance cryptocurrency platform continues to see increased adoption and steady growth of the XRP price.
Recent studies show that Ripple’s XRP owners, alongside owners of other altcoins such as Polkadot and Stellar, are the most anxious in the crypto industry.
The study shows that crypto trading can bring about loss of sleep and anxiety among other negative psychological effects.
However, we beg to differ on that, and rather say that you can have a good crypto trading/life balance by including the analysis from our posts in your trading repertoire.
Read on as we identify the significant trend, resistance, and support levels on the XRPUSDT chart starting from the weekly chart, to the daily and 4HR intraday time frame.
XRP Weekly Chart Analysis

There’s been a steady uptrend on the weekly time frame of the XRPUSDT as the price chart sets higher troughs with the RSI exiting the oversold areas on 09 March ’20 and 22 June ’20.
The weekly chart overview of the XRPUSDT shows the bullish campaign starting after a breakout of bearish resistance on 04 Jan ’21 for an increase of about 500%, then find resistance at 1.9669.
An exit of oversold level-25 in combination with a hidden bullish divergence on 12 Jul ’21 shoots the XRP price higher [1.3046].
The bear trap candlestick formation on 20 Sep ’21 confirms the price bottom as the bulls get set to shoot for the XRP ATH.
XRP Daily Chart Analysis
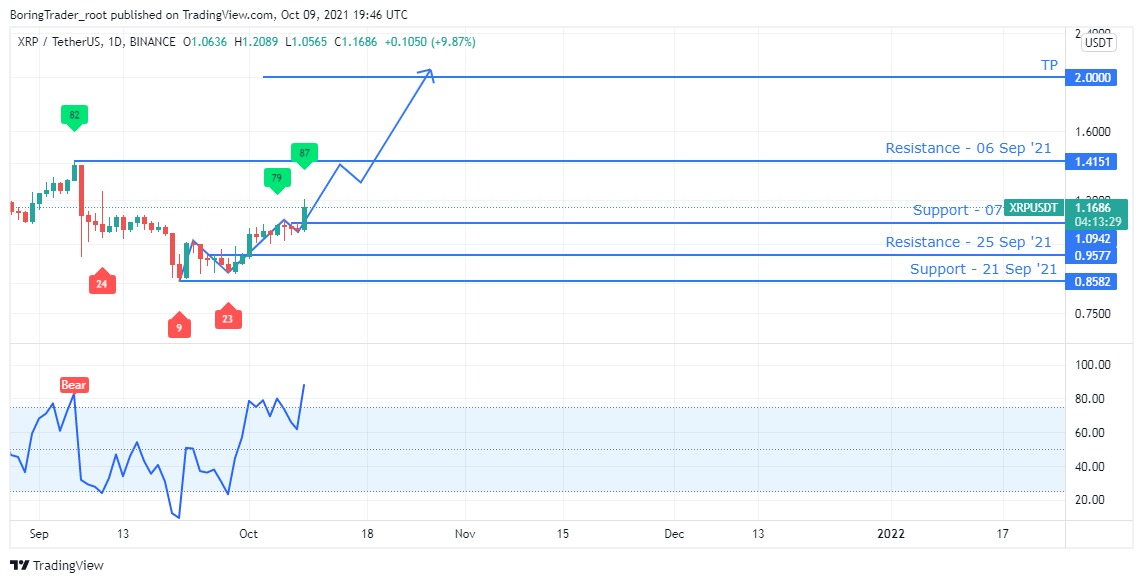
Demand for the XRP token slowly grows as the RSI enters the overbought level-75 on the daily time frame. Buying power increase at press time forcing the 1.0942 resistance to give way as the bull’s eye the 1.4151.
The $2.00 round-number mark is the next projected target of the bulls that can overcome the 1.4151 resistance.
XRP 4HR Chart Analysis

The 4HR time frame confirms the uptrend on the daily time frame with the RSI dipping below level-25 on 29 Sep ’21 00:00 and 06 October ’21 08:00.
We may want to wait for the RSI to drop below level-75 before jumping into the current uptrend with the $1.40 round-number mark as our next price target.
A bearish scenario and black swan event would start with a price close below the 1.0171 support, where we can expect to see further price declines.
With that said, a likely zone to place a stop-loss order in a bullish scenario would be below the 1.0171 support.
XRP Intraday Levels
- Spot rate: 1.1782
- Mid–Term Trend [H4]: Bullish
- Volatility: High
- Support: $1.0589, $1.0171, and $0.8861
- Resistance: $1.2089, $1.400
- Trending
- Price Analysis
- Ethereum, Shiba Inu Price Analysis: October 11, 2021
- Bitcoin Price Prediction: BTC Continues Explosion To $60,000 Amid A Whale Buying Spree
- Can Bitcoin Save the Planet? This Lawmaker Highlights How BTC’s Mining Narratives Can Change
- Bitcoin Price Prediction: BTC Continues Explosion To $60,000 Amid A Whale Buying Spree
- Crypto Crackdown: Bitmain to Stop Shipping Antminers to China This October
- Bitcoin Price Forecast: BTC Heading For $60,000 But Bulls Must Hold $55,000 Supply Zone