


Toncoin (TON), the cryptocurrency linked to the popular messaging app Telegram, soared to its year-to-date high of $7.54 on June 6. However, it has since shed some of its value, trading at $7.03 at press time.
As the altcoin continues to see its demand fall, its price remains at risk of falling below the $7 price level.
Toncoin Demand Falls in the Past Week
Toncoin’s (TON) 7% price fall since it rallied to its year-to-date high has been due to the decline in buying momentum in the last week. This was confirmed by the drop observed in the count of TON’s daily active addresses and new address count in the past week.
During that period, the number of active addresses that completed at least one TON transaction dropped by 10%. Likewise, the number of new addresses created daily to trade TON fell by 19% during that period.
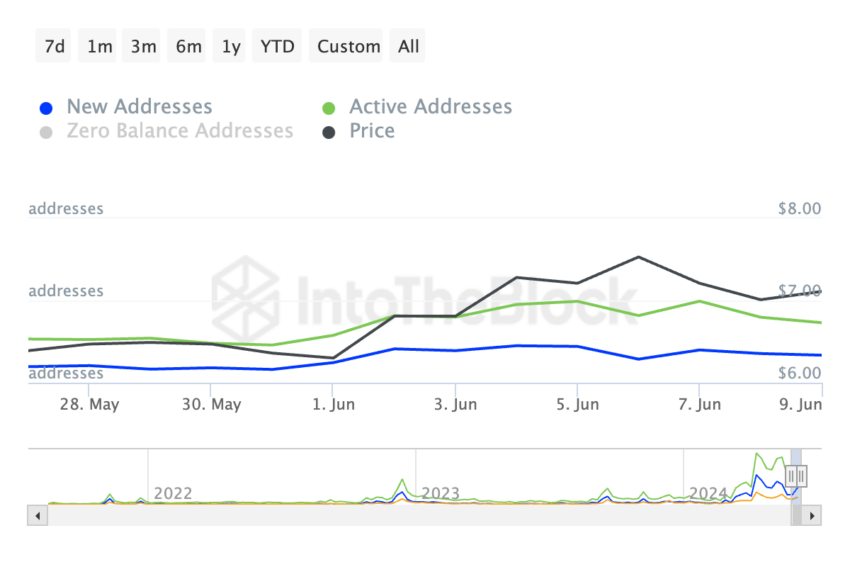
When an asset witnesses a decrease in user demand like this, it heightens the risk of a further price decline. This is because it discourages new users from entering the market and existing users from actively trading the crypto asset.
Further, TON’s falling Relative Strength Index (), as observed on-chain, confirmed the surge in selling pressure. At press time, this indicator trended downward and returned a value of 58.
Read More: What Are Telegram Bot Coins?
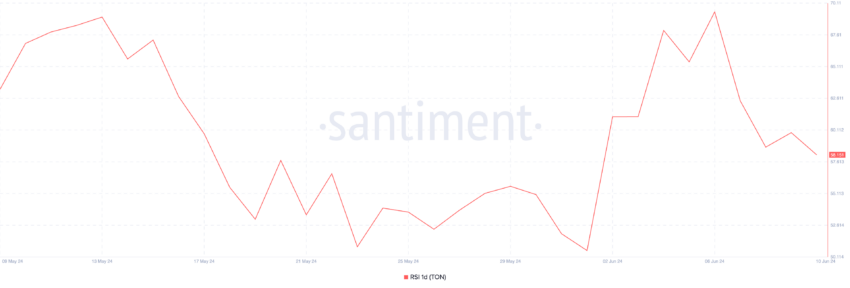
An asset’s RSI measures the momentum of its recent price movements. It typically ranges from 0 to 100, with values above 70 indicating that the asset is overbought and values below 30 suggesting it is oversold.
TON Price Prediction: Price Aims For Support
TON has trended within an ascending channel since May. An ascending channel is a bullish signal formed when an asset’s price makes higher highs and higher lows.
It is characterized by two upward-sloping trend lines: the upper trend line, which represents resistance, and the lower trend line, which forms support.
TON has faced resistance at $8.64 and found support at $6.8. At $7.03 and declining as of this writing, TON appears poised to fall to support and below it.
Readings from the altcoin’s Moving average convergence/divergence (MACD) indicator hint at this possibility. At press time, TON’s MACD line (blue) is geared to cross below its signal line (orange).
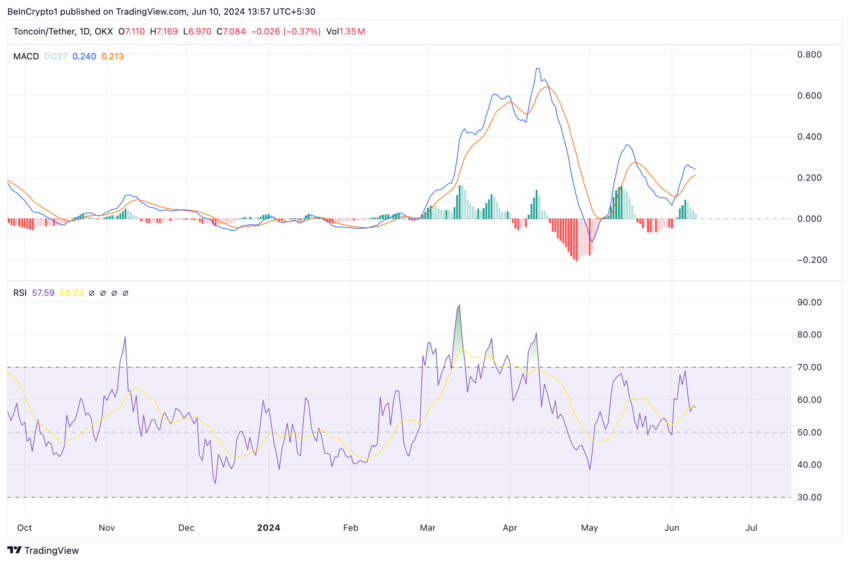
This indicator identifies an asset’s price momentum changes and potential trend reversals. A downward intersection of the MACD line with the signal line is considered a bearish crossover. It is a signal that often precedes an asset’s price downtrend. Traders interpret it as a sign to exit long and open short positions.
If this happens and the bears regain full market control, TON’s price might plummet to $6.41 under support.
Read More: 11 Cryptos To Add To Your Portfolio Before Altcoin Season
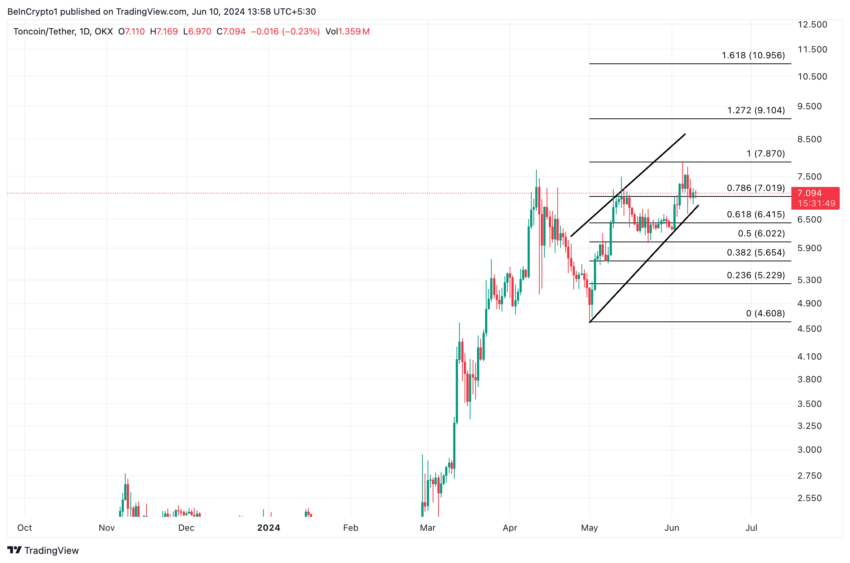
However, if invalidated, the altcoin’s value might climb to $7.01 and trend toward resistance.