


 90
90
Amid regulatory uncertainties, India’s top crypto exchange, ZebPay, recently announced the listing of Shiba Inu’s SHIB token on its platform, following the path of Bitpanda, COINBASE Pro, and Binance. The SHIB price rose by roughly 350% from its October opening price bringing its market cap to the 18th position at press time, and quickly lives up to its name as the “DOGE killer”.
A partnership with the crypto payment processor NowPayment will involve burning a percentage of the SHIB token on every transaction, and consequently reducing its supply.
Could this be the needed catalysts for the SHIBUSDT to escape the current 0.000035 resistance? Let’s find out by analyzing the weekly, daily, and 4HR charts of the SHIBUSDT.
Shiba Inu (SHIB) Weekly Chart Analysis

A sudden increase in demand for the SHIB token triggered by a regular bullish divergence on 06 September, saw the price of the SHIBUSDT soaring above the 09 August bearish divergence trend line.
The price surge started to cool off a bit upon striking the Poloniex all-time high of 0.000035, a healthy correction that’s needed for the SHIB price to continue to the 0.00005 high.
SHIB token holders are confident of the current price hike as the RSI continues to soar above level-75 and level-25.
Shiba Inu (SHIB) Daily Chart Analysis
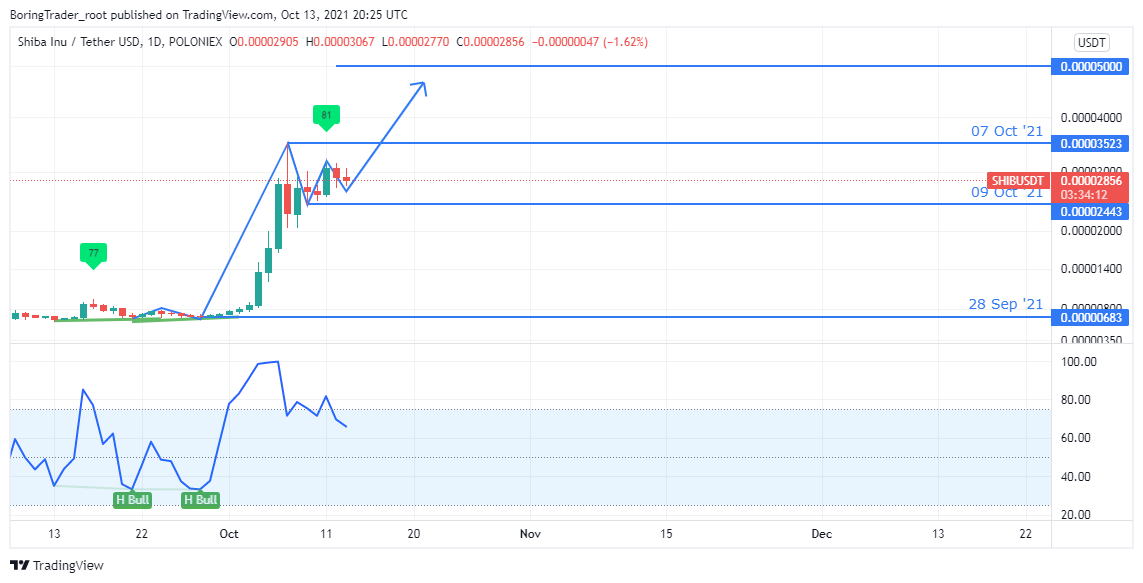
Coming down to the daily time frame, the 380% impulse wave set up by the regular bullish divergence on 28 September ’21 slowly enters into a correction phase in the form of an ascending triangle chart pattern.
Two important price drivers to look out for are the RSI piercing level-75 and continues to trade above level-25; and a recent breakout of bearish inside-bar resistance [0.00002779] on 11 October ’21.
Also, we notice a hidden bullish divergence as the SHIB price forms higher troughs while the RSI forms lower troughs on 07 and 12 October. We’ll get a clearer picture of the bullish divergence on the 4HR time frame analysis below.
Shiba Inu (SHIB) 4HR Chart Analysis

The SHIBUSDT slowly exits a previous expanding channel set up by bearish and bullish divergence patterns on 07 08:00 and 20:00 October, and transitions into an ascending triangle chart pattern.
Hidden bullish divergence patterns on 07 October 20:00 and 12 October 12:00 suggests a continuation of the uptrend where the price could skyrocket beyond the 0.000035 resistance.
Conversely, a breakdown of the 0.00002058 support line would hint rapid profit taking and increase in shorting interest.
Shiba Inu (SHIB) Intraday Levels
- Spot rate: 0.00002916
- Mid–Term Trend [H4]: Strong Bullish
- Volatility: High
- Support: $0.00002058 and $0.00002733
- Resistance: $0.000035 and $0.000050
- Trending
- Price Analysis
- SHIB Price Analysis: Shiba Inu Price Hints Breakout of Ascending Triangle Resistance Amid Token Burning News
- Ravendex – Private Sale Continues With Landmarks, Sells Out 60% of its Allotted Tokens, To Release MVP Before End Of Q4 2021
- Forkast, AAX Present “Bitcoin & Beyond” on Nov 10
- Bitcoin Price Forecast: BTC Draws Closer To ATH Near $65,000 Amid Potential Demand From Developing Countries
- Bitcoin Price Prediction: BTC Continues Explosion To $60,000 Amid A Whale Buying Spree
- Crypto Crackdown: Bitmain to Stop Shipping Antminers to China This October