


Ripple price staged a formidable recovery last week from lows under $0.15 to highs at $0.1750. The bullish wave came as a result of Bitcoin (BTC) surge towards $7,000. Note that Ripple price just like most of the altcoins is still strongly correlated to BTC.
Following the rejection from the weekly high, XRP/USD spent the weekend searching for balance. $0.16 failed to stand as support area although it was a huge resistance zone in last week’s recovery. Losses extended under $0.15 before support embraced at the 23.6% Fibonacci retracement level between the last drop from $0.25731 to $0.11 forced Ripple price into the ongoing recovery.
XRP/USD 4-hour chart
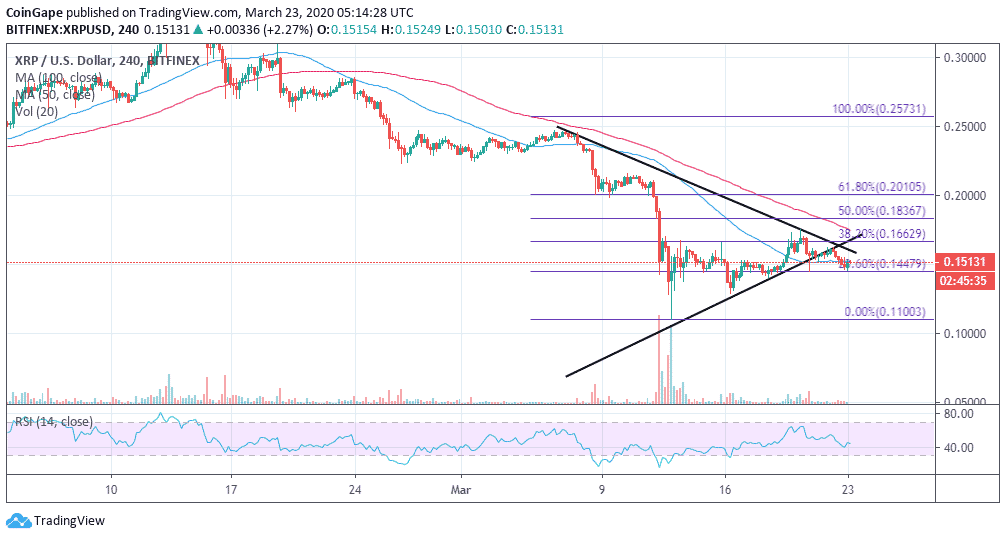
XRP/USD is up 1.94% on the day to trade at $0.1511 from $0.1477 (opening value). The immediate upside is capped by the 50 Simple Moving Average (SMA) in the 4-hour range. More resistance is expected at $0.1660 (38.2% Fibo) and $0.20 (61.8% Fibo). On the downside, the 23.6% Fibo is the next formidable support zone.
The retreat from the recent high at $0.1750 extended the bearish action under a symmetrical triangle. The negative impact of the triangle breakout still hovers and risks pushing XRP/USD below the support at $0.14; a move that could result in a breakdown at $0.12. Besides, the rejection of the uptrend confirms the bearish signals from technical indicators such as the MACD and the moving averages (the wide gap between the 50 SMA and the 100 SMA).
Ripple Key Levels
Spot rate: $0.1511
Relative change: 0.00323
Percentage change: 2.18%
Trend: Bearish
Volatility: Shrinking