


Ripple is settling in for consolidation above $0.20. This follows a negative price action from the seller congestion zone at $0.21. The support has been instrumental to the stability in the last couple of days. However, all attempts to clear the hurdles under $0.21 have been thwarted by the strong bearish grip.
At the time of preparing this analysis, XRP/USD is dancing with $0.2022. Buyers are facing increasing selling pressure. Moreover, the high volatility greatly puts short term support at $0.20 in jeopardy. Also in line to offer support is the 38.2% Fibonacci retracement level taken between the last drop from $0.3491 to a swing low of $0.10.
From a technical perspective, XRP is poised to continue with the bearish inclination in the coming sessions. The RSI, when taken into account shows that bears are in the driver seat. The high concentration of buyers at $0.20 and the 38.2% Fibo are aiding in averting losses that could test other support areas at $0.19 and $0.1750.
XRP/USD daily chart
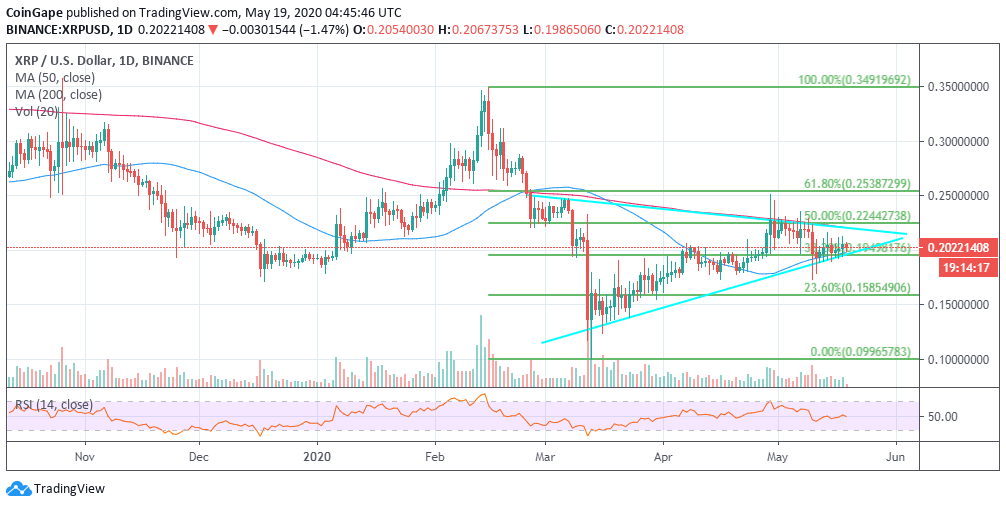
On the other hand, the formation of a symmetrical triangle pattern introduces a bullish and a bearish scenario. If the price embarks on a journey of breaking barriers, starting with the hurdle at $0.21, gains above the triangle pattern would pave the way for more action towards $0.25. On the flip side, XRP is grinding closer and closer to the triangle support. If the support is shuttered, a nosedive to $0.1750 is possible. Moreover, the major support at $0.1500 could also be tested. For now, the best idea for the bulls is to keep the price above $0.20.
Ripple Intraday Key Levels
Spot rate:
Relative change:
Percentage change:
Trend:
Volatility: