


Do repost and rate:
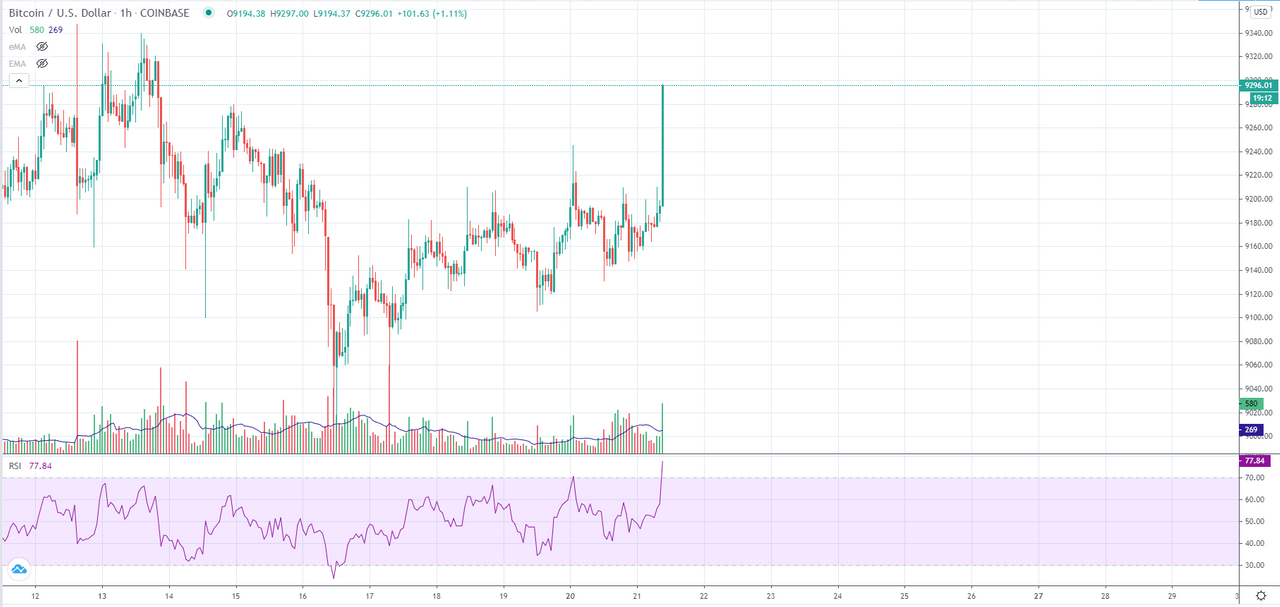
Still too early to say that we are out of BEAR's JAWS but, is it not nice to see this show on the 1-Hour chart?
Let's see what we have on the 4-hours chart:
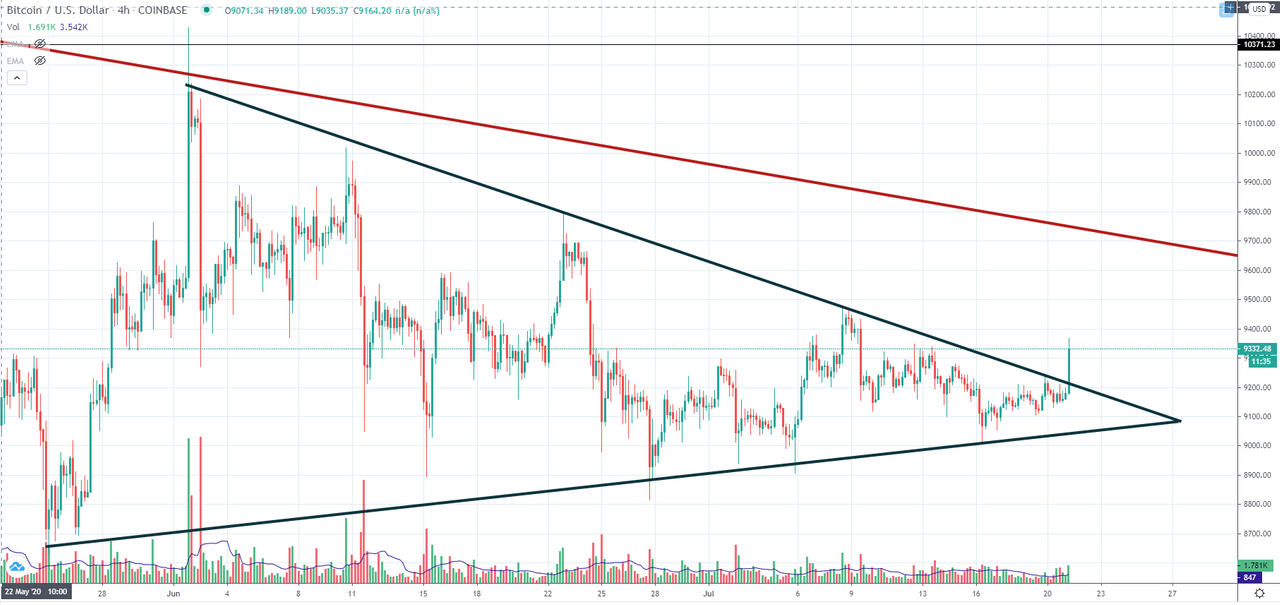
Symmetrical triangle breakage?
What about the Daily Chart?
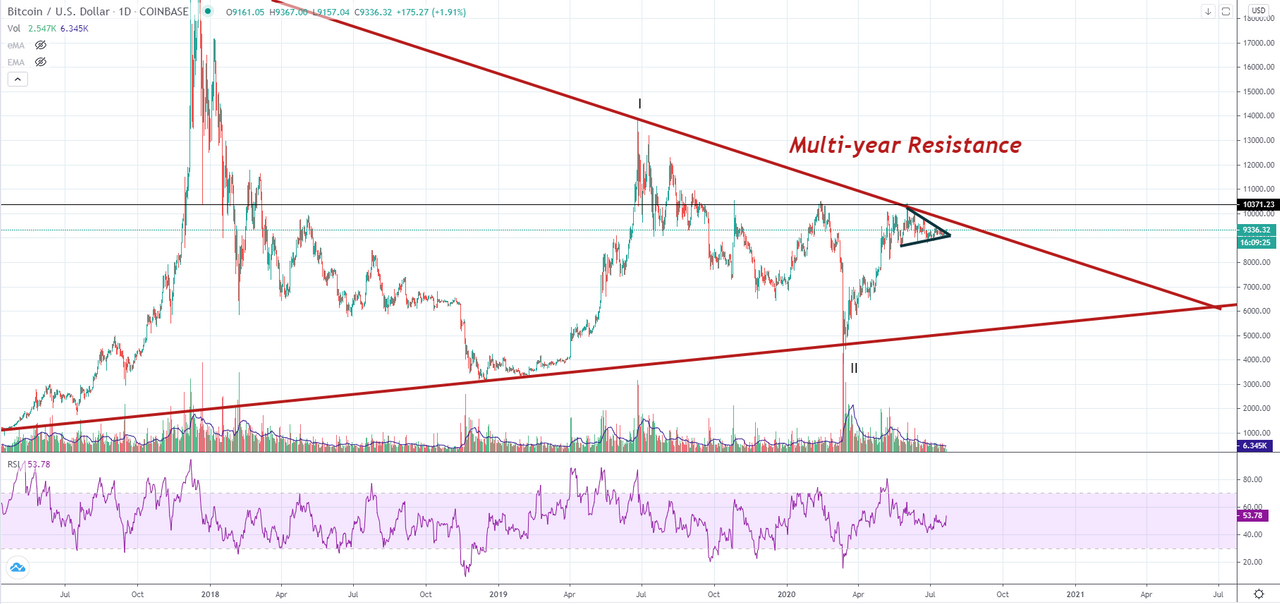
Approaching to the Multi-year resistance (in RED)
But, in order to confirm this Bull trend, we need:
- Daily Volume increase: Currently stuck around 15 billion USD
- Breakage of the Multiyear resistance
- Breakage of the previous High (10300 USD)
Still far from the targets of Bullish confirmation but there is always margin for more accumulation.
@toofasteddie
*Disclaimer: This is just my personal point of view, please, do your own assessment and act consequently. Neither this post nor myself is responsible of any of your profit/losses obtained as a result of this information.