


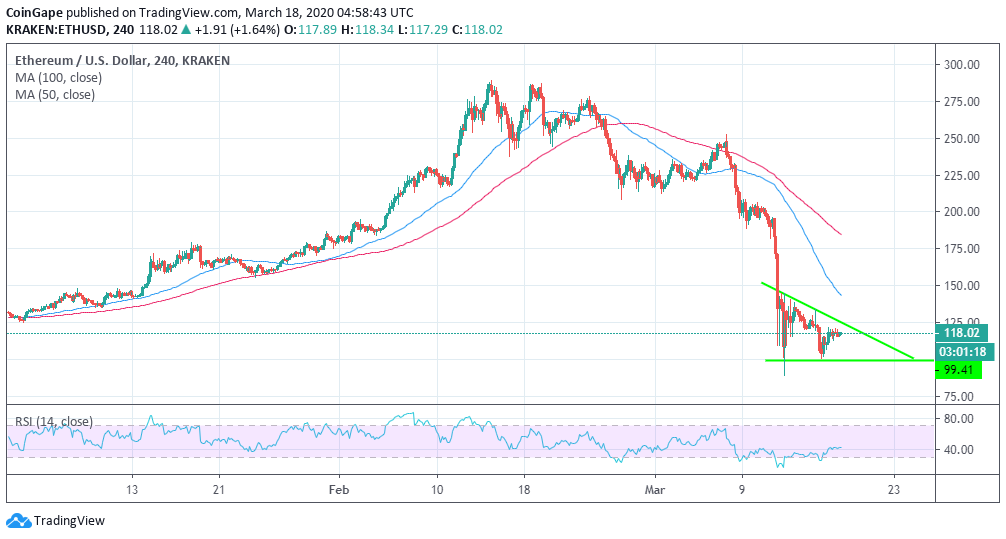
Following the thunderous plunge to $90 last week, Ethereum price has been consolidating within a triangle pattern. Recovery has been capped under a descending trendline while $150 remains a critical (decision/pivot) point to the second-largest cryptocurrency. The rejection from $150 has also highlighted other support areas at $110 and $100.
At the time of writing, ETH/USD is trading at $118. A positive relative change hints that buyers are slightly in control. At the same time, Ethereum price has grown 1.64% from its opening value ($116) on Wednesday.
From a technical perspective, the Relative Strength Index (RSI) shows that the trend is in the favor of the bulls. However, the buyers lack the power or catalyst to break above the resistance at $120 and sustain gains towards $130. ETH/USD is also trading below the moving averages; a sign that selling activities are still high. The widening gap between the 50 SMA and the 100 SMA is a key indicator of the selling pressure.
ETH/USD 4-hour chart
On the brighter side, Ethereum’s consolidation in the falling triangle could end up in an upward breakout. A rally, although a brief one is expected to pull ETH/USD above $130. Significant movement upwards will also encourage more investors and buyers to join the market as sentiments change positively towards Ether. Increased trading volume and supporting fundamentals could eventually boost ETH/USD towards $200.
Ethereum Key Levels
Spot rate: $118
Relative change: 1.93
Percentage change: 1.66%
Volatility: High
Trend: Short term bearish bias