HBAR, the native token for the Hedera Hashgraph ecosystem maintains a bullish outlook following the recent launch of Circle’s USDC stablecoin on the HBAR ecosystem. Why, recently Circle’s VP of Product Joao Reginatto in an interview with CoinDesk, highlighted the need to prioritize the HBAR token ecosystem earlier this year, owing to its power for more enterprise use cases.
Going forward, the USDC on Hedera will be compatible with existing Circle Accounts and Circle Payments, Payouts, and Accounts APIs as stated in a recent press release.
Read on as we analyze the demand and supply of HBARBTC and HBARUSDT below.
HBAR Price Analysis: HBARBTC Weekly Chart Analysis
The recent rise in Bitcoin BTC dominance forced a decline in demand for major altcoins, including the HBAR crypto-asset.
Conversely, higher RSI readings above level-25 and level-75 indicate that this may not last for long as an impending bullish divergence at press time could resume demand for the HBAR crypto.
HBAR Price Analysis: HBARUSDT Weekly Chart Analysis
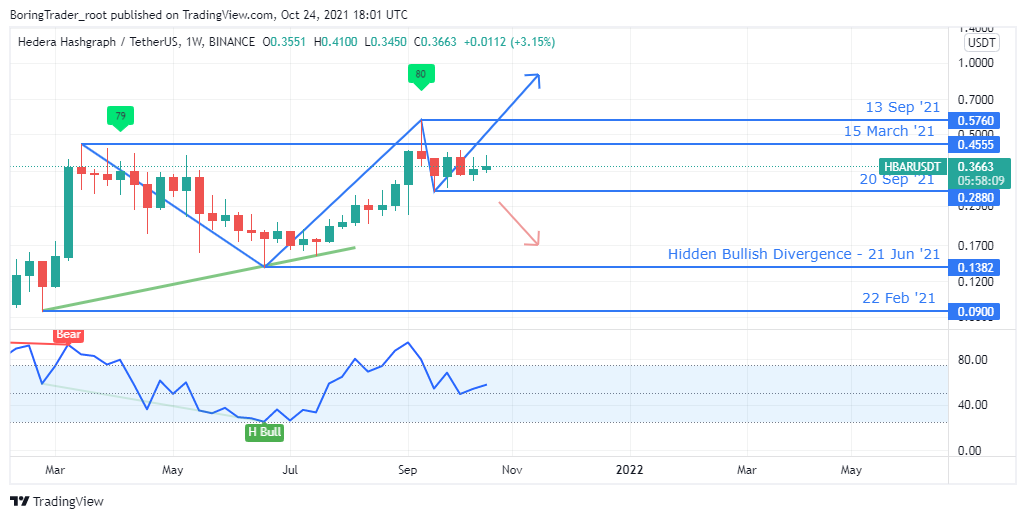
Higher RSI readings above level-25 and level-75 alongside the hidden bullish divergence on 21 June suggests that the bulls are still in control of the market.
A price dip following a new ATH at 0.5760 implies that the HBAR price is in a correction phase where the entry signals to resume the uptrend will be triggered by an oversold level on the daily time frame.
Let’s move on to the daily time frame below.
HBAR Price Analysis: HBARUSDT Daily Chart Analysis
The HBARUSDT trades in a range-bound market structure as revealed from the chart above.
A series of hidden bullish divergence on 21 September and 12 October shows a bias to the upside, which hints that the HBARUSDT could likely break the 0.4280 resistance.
Conversely, a breach of the 21 September [0.2880] low suggests low interest for the HBAR cryptocurrency and higher selling pressure to come.
Note that the bullish divergence was triggered while the RSI was in oversold territory, an indication that the bulls may have found a price floor.
HBAR Price Analysis: HBARUSDT 4 hr Chart Analysis
The HBAR crypto-asset forms higher peaks and troughs with the recent trough formed after the RSI dipped below level-25 on 24 October 16:00.
Similar to the daily time frame and weekly time frame combination of exit of level-75 [weekly chart] and entry of oversold level-25 [daily], the 4HR time frame also enters the oversold area, while the daily time frame trades above level-25 on the daily time frame at press time.
This is generally a bullish signal for the HBARUSDT. We expect the bullish momentum to persist considering the recent positive developments taking place within the HBAR ecosystem.
- Trending
- Price Analysis
- Bitcoin Bargain: German Law enforcement agency’s confiscated Bitcoin auction gets exceptional traction
- Breaking: Nigeria Becomes First African Nation to Launch a CBDC
- HBAR Price Prediction: Hedera Hashgraph (HBAR) In Full Moon Mode As Price Confirms Hidden Bullish Divergence On The Weekly Charts
- Bitcoin Price Pullback Holds Above $59,000 As Bulls Plot Ultimate Rally To $70,000
- Solana, Avalanche Price Analysis: October 22
- Bitcoin Price Is Only 10% To $70,000 As Exchange Withdrawals Hit 4-Month High


 115
115


