


- Ethereum price bounces off support at $128 to tests the critical resistance at $140.
- ETH/USD remains bullish while aiming for a breakout above $140 with buyers’ eyes glued on $150.
Ethereum buyer keenly defended the support at $124 following the breakdown over the weekend. Recovery this week initially stalled under $136. Consolidation took over between the 50% Fibonacci level and the 61.8% Fibonacci level of the last swing high at $144.11 to a swing low at $119.22. A slight dip under $130 on Wednesday bounced off new support at $128. The bullish action broke above the 50 Simple Moving Average and the 100 SMA in the 1-hour range. ETH/USD zoomed towards $140 but hit a wall at $138.97 (on Coinbase) cutting short the bullish momentum.
ETH/USD 1-hour chart
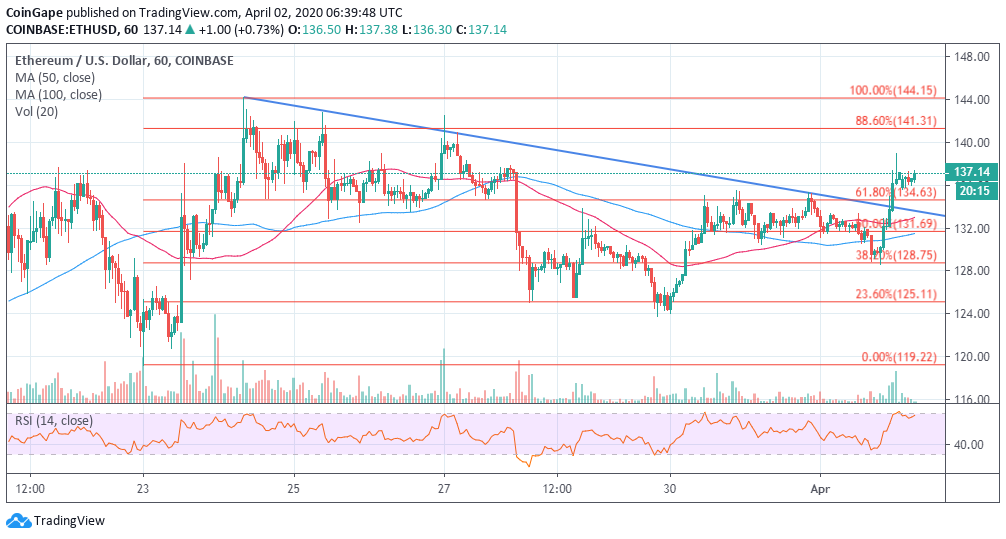
At the time of writing, Ethereum is trading at $137.11 following a 0.75% growth on the day. The bulls are working on extending the leg above $140 in anticipation of a breakout towards $150. The Relative Strength Index (RSI) is almost hitting oversold conditions in the hourly timeframe. As long as the RSI nurtures the uptrend regardless of the overbought conditions, ETH/USD could strengthen the bullish grip above $140. The ongoing bullish action is banking on trading activities increasing to sustain the breakout.
If the hurdle at $140 proves impenetrable, a reflex downside action could retest the support at the 61.8% Fibonacci level. Further downside action would seek balance at $128 and $124 support levels respectively.
Ethereum Key Levels
Spot rate: $137.11
Relative change: 1.00 daily
Percentage change: 0.78% on the day
RSI: Bullish bias (almost overbought 1-hour).
Trend: Bullish