


Ethereum hit October highs at $420 but retreated to support provided by the 100 Simple Moving Average (SMA) marginally above $370 in the 4-hour range. Towards the end of the month, buyers took back control over the price, elevating Ethereum above $410. The impressive price action coincided with Bitcoin’s price rally above $13,000. Unfortunately, a retreat occurred with ETH diving back to the drawing board at $370.
Meanwhile, Ethereum is trading at $400 following a remarkable weekend price action that took down several resistance zones, including the 100 SMA and 50 SMA. A short-lived constriction of the Bollinger bands contributed to the upward price action. For now, the path with the least hurdles is to the north, especially with the price trading above Bollinger Bands.
The Relative Strength Index (RSI) reinforces the bullish outlook after coming out of a downtrend and grinding closer to the overbought area. Besides, Ethereum’s immediate downside is supported by the Bollinger Band upper boundary in conjunction with the 50 SMA.
ETH/USD 4-hour chart
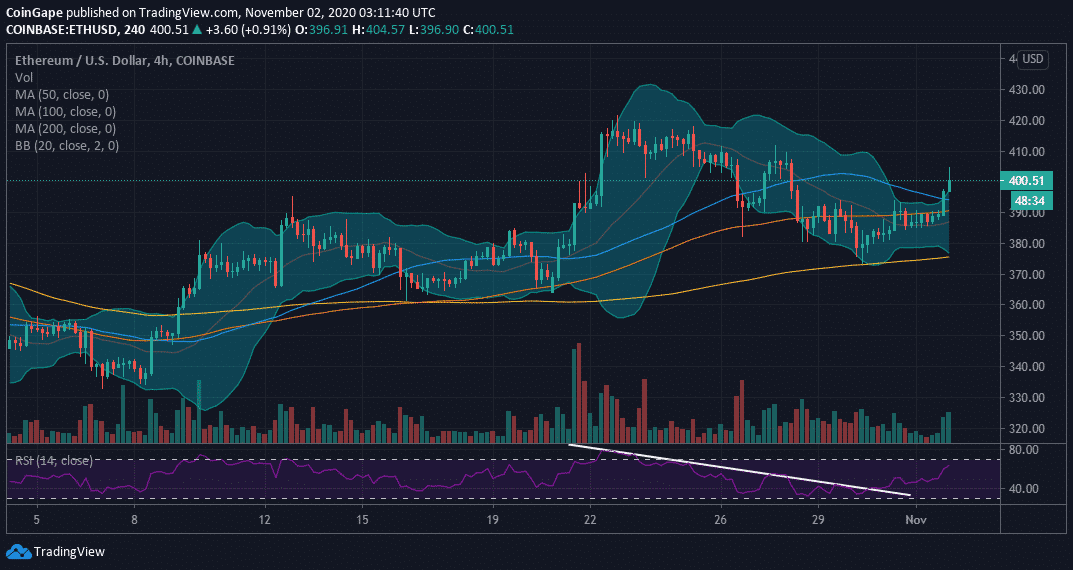
The price must settle above $400 for sustained price action. Resistance at $410 and $420 may delay the breakout eyeing $430. For now, the smart contract token is in the hands of the bulls, whose desire is to take off to $500.
The bullish outlook will be invalidated if ETH/USD slides back into the Bollinger Bands and below the 50 SMA. The lower leg may also test the buyer congestion at $390, as highlighted by the 100 SMA. If declines progress, Ethereum will explore the rabbit hole, grinding to the primary support at the 200 SMA.
Ethereum Intraday Levels
Spot rate: $400
Relative change: 3
Percentage change: 0.7%
Trend: Bullish
Volatility: Low

To keep track of DeFi updates in real time, check out our DeFi news feed Here.