


Ethereum price is leading recovery among the top three digital assets. After opening the session on Monday above at $199.59, the bulls pulled the price above $200. An intraday high has been formed at $204.43 (current immediate resistance). Ethereum is valued at $203.22 at the time of writing, representing a 1.82% growth on the day.
Looking at the 2-hour chart, the price is trading between the 200 Simple Moving Average (SMA) support and the 50 SMA resistance. The narrowing gap between the moving averages hints towards a growing sellers’ grip. The growth above $200 appears to be in jeopardy especially with the RSI’s uptrend action stalling short of 50.
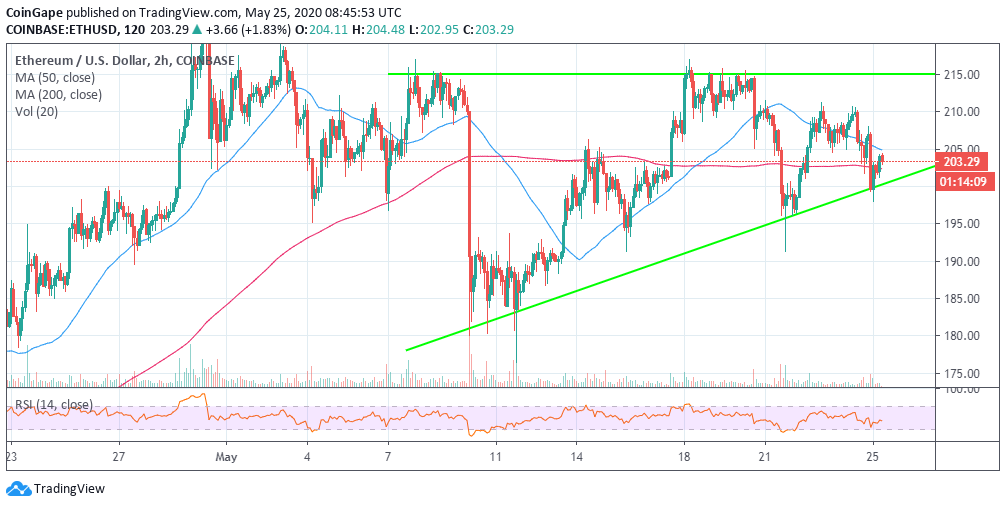
ETH/USD 2-hour chart
Marginally above the market value, is the aforementioned resistance between $204 (intraday high) and the 50 SMA ($205) in the 2-hour range. To sustain the uptrend that started after Ether tested $190 support last week, the resistance at the 50 SMA must come down. This will allow the bulls to focus on higher resistance at $210, $215 and $220 respectively.
Taking into account a wider perspective, Ethereum is not in the clear yet despite the recovery from $190. The triangle resistance at $215 has to be broken for more sustained and guaranteed price action towards $230 and $250. On the other hand, a triangle support breakdown still in the event the critical level at $200 fails to hold.
Ethereum Key Intraday Levels
Spot rate: $203.22
Percentage change: 1.82%
Relative change: 6.66
High: 204.43
Low: 198.05
Trend: Bearish
Volatility: Low