


The Ethereum (ETH) price has increased significantly since October and is approaching a long-term horizontal resistance area.
Can ETH break out above this area and finally end its underperformance relative to the rest of the crypto market? Let’s find out!
Ethereum Approaches Critical Resistance
Ethereum price has increased alongside an ascending support trend line since May 2022. The trend line has been validated numerous times, most recently in October 2023 (green icon). Since then, ETH has created eight bullish candlesticks in eleven weeks and is currently creating the ninth such candlestick.
ETH price has reached a long-term horizontal resistance area, which has existed since the start of 2022.
Traders utilize the RSI as a momentum indicator to assess whether a market is overbought or oversold and whether to accumulate or sell an asset. If the reading is above 50 and the trend is upward, bulls still have an advantage, but if the reading is below 50, the opposite is true.
The weekly RSI is increasing and has nearly crossed into overbought territory. Previously, this catalyzed a parabolic upward movement (green vertical trend line).
What Do Analysts Say?
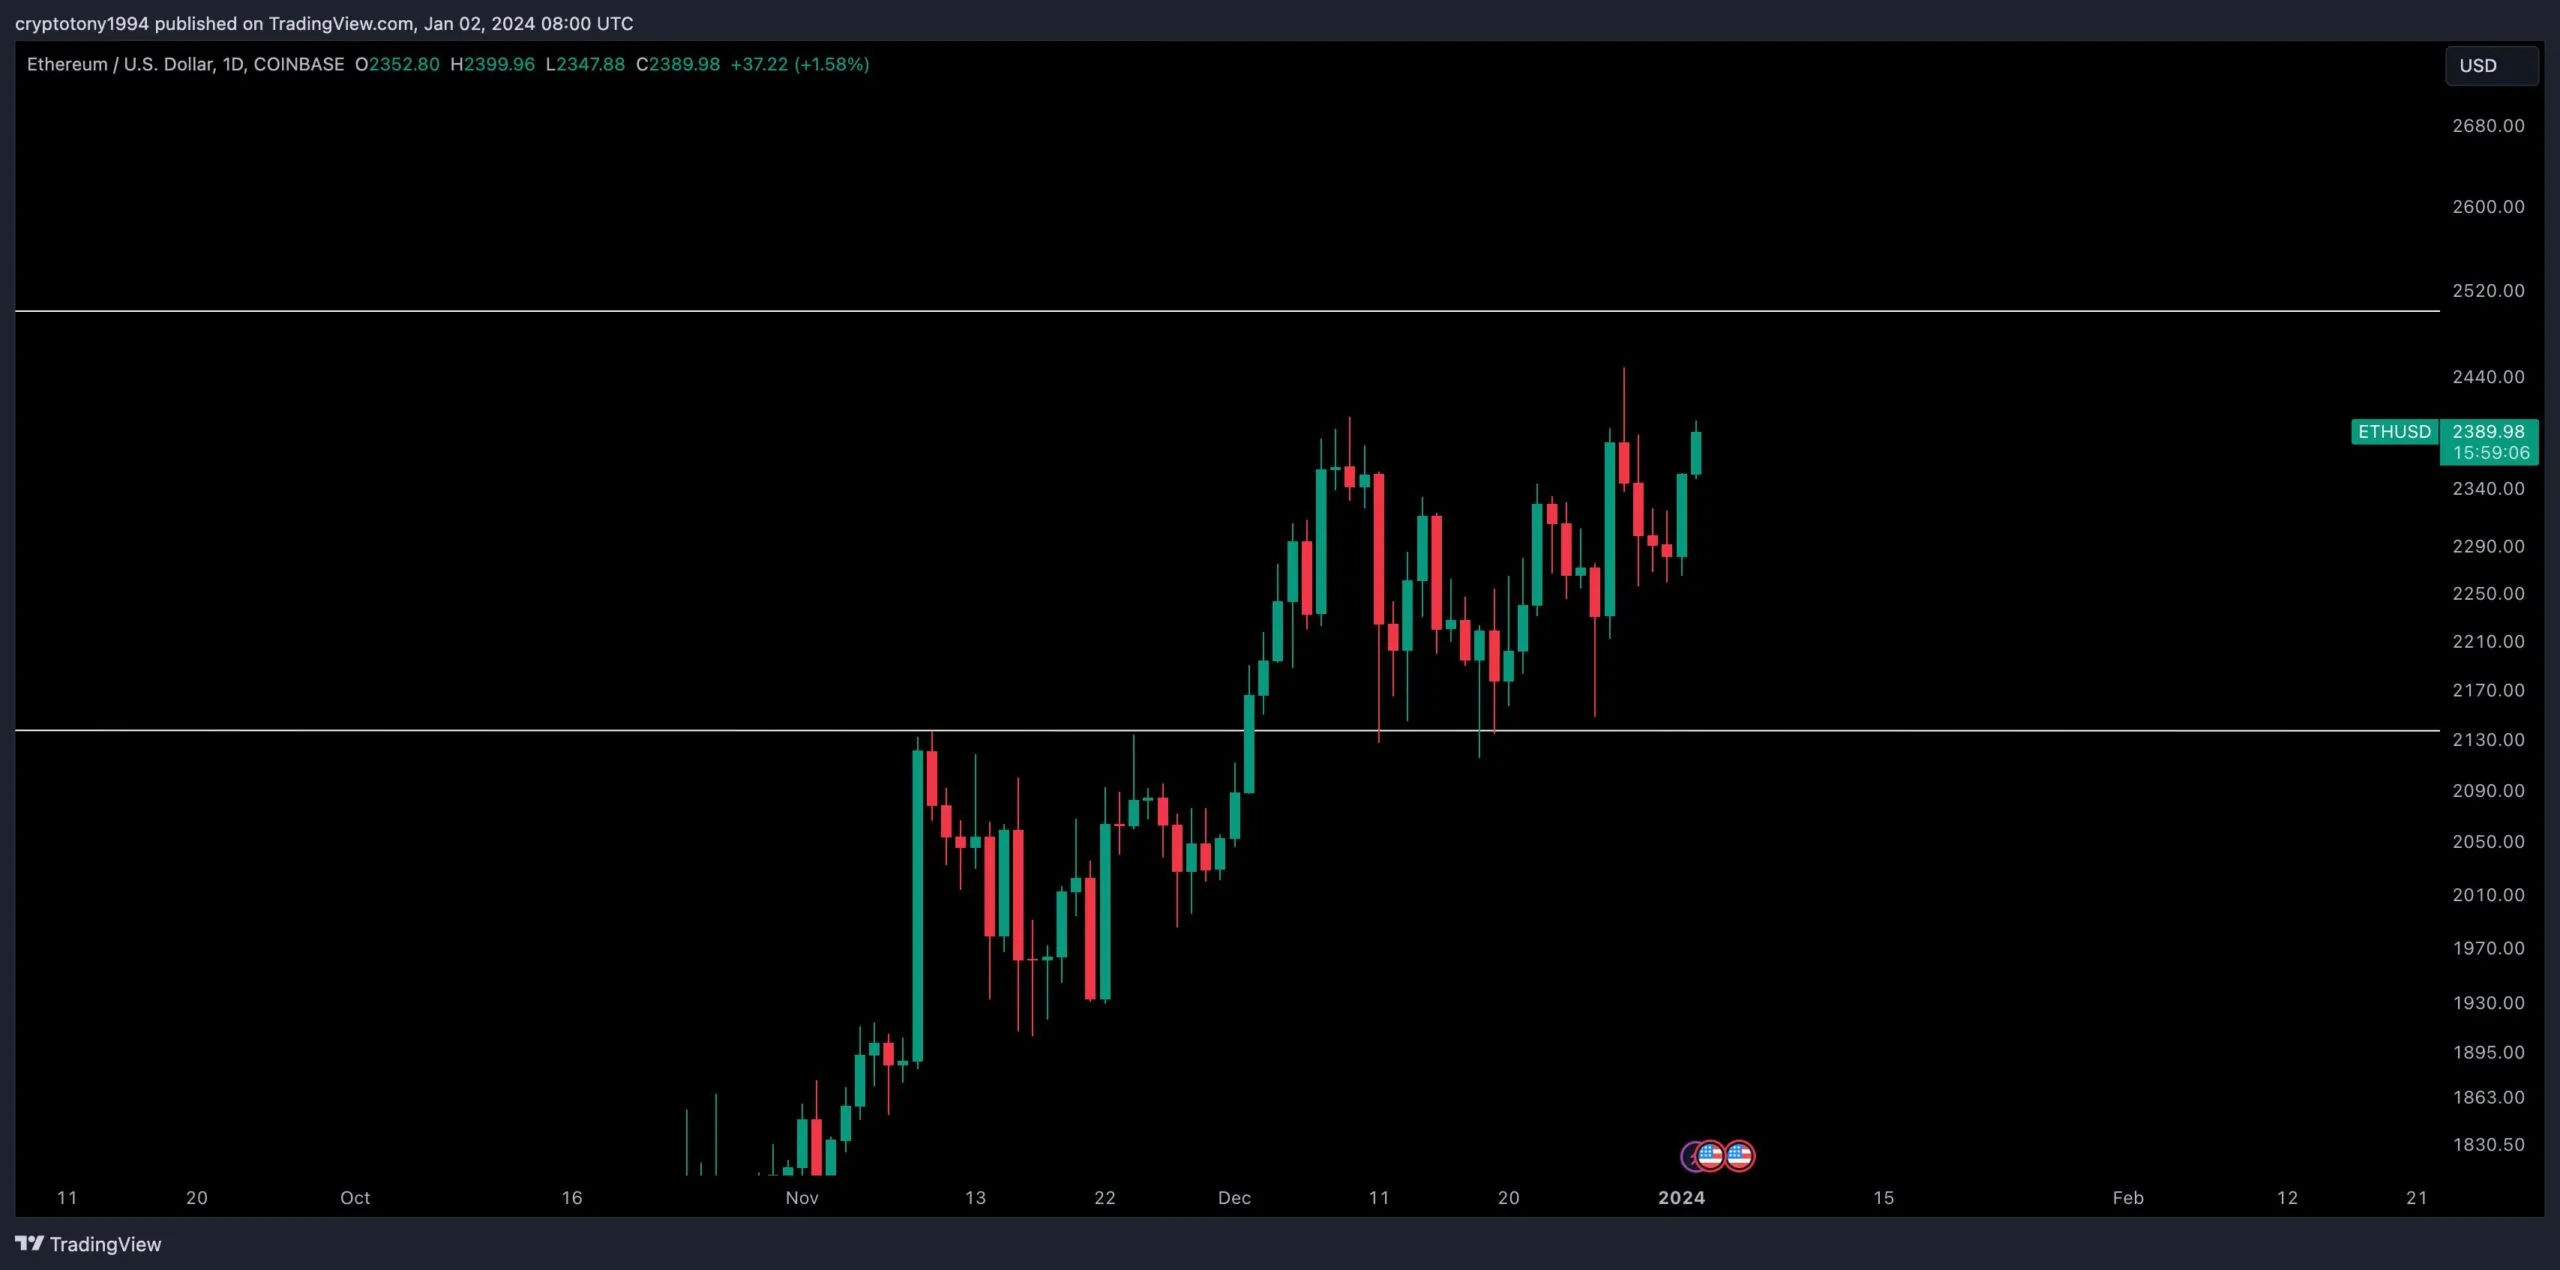
Cryptocurrency traders and analysts have a bullish view of the future ETH trend. Due to reclaiming the previous range, Crypto Tony believes that the next target is between $2,500 and $2,600.
CryptoMichNL believes Ethereum will outperform Bitcoin in 2024. Finally, BrianH believes that the upcoming Cancun-Deneb upgrade will reduce transaction fees on Ethereum and its Layer-2 scaling solutions:
The upcoming Cancun Deneb hard fork and the Proto-Danksharding update are expected to reduce the cost of publishing proofs on L1 for layer 2 solutions. This will likely result in lower transaction costs on layer 2 platforms.
Read More: Ethereum (ETH) Merge: All You Need to Know
ETH Price Prediction: When Will Price Reach $3,000?
technical analysis of the daily time frame gives a bullish outlook on the future ETH trend because of the price action and RSI readings.
The price action shows that after breaking out from a long-term resistance at $2,120 and validating it as support (green icon), Ethereum is breaking out from the minor resistance at $2,370.
The daily RSI supports this increase since it generated a hidden bullish divergence (yellow), a sign of trend continuation.
Since there is a lack of overhead resistance, a close above this area can trigger a sharp upward movement to the next resistance at between $3,360 and $3,500. This is 40% above the current price.
Despite this bullish ETH price prediction, a close below $2,370 can lead to a 12% drop in the $2,120 horizontal support area.