


Another "mental masturbation" I had lately is regarding the use of some of the "famous" indicators that are commonly used by traders in their decision taking process.
As you may know, there are dozens if not hundreds of those indicators which try to anticipate next price movements. On top of them, the most commonly used are:
- Relative Strength Index (RSI)
- Moving average
- Bollinger Bands
- Momentum Oscillator
Personally, when I have to take decisions about trading, I used to check a few of those indicators but I don't rely on only a specific one for that. I use my knowledge regarding Elliot-Waves theory, Candlesticks, Resistance and Support, patterns, volume and Open interest in order to base my position... As everything in life, I try to mitigate risks by doing so but still the risk is there and not always the best "set-up" deploys a positive result.
Being said that, actually, there are many traders that only rely on Trading indicators and, sometimes, they make use of automatic tools/bots in order to trigger the SELL/BUY order based on them.
I would like to know the "efficiency" on the most famous indicators and so, I am starting to asses them.
Today I am presenting you my assessment on the RSI Indicator
The RSI, aka "Relative Strength Index" , is an indicator on which most analysts will recommend traders to sell the stock when the RSI touches 70 and a buy recommendation when it falls to 30.
And this is what I am going to test by using the RSI indicator on the 4-Hour Chart of BITCOIN.
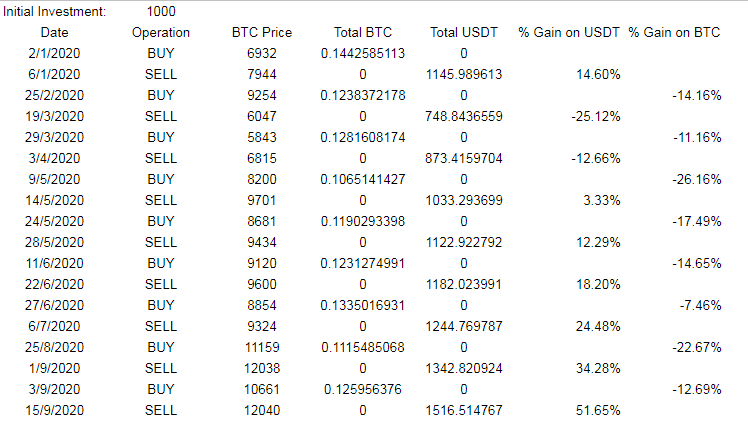
So, basically, I trace back all the RSI signals on the pair BTC/USDT 4-h chart, starting form the 1st of January 2020, and I assume that when the RSI Signal touches the line of 30 I automatically buy BTC and when it touches 70 I automatically sell all the bought BTC, then, this process of selling/buying is repeated till the end but always selling and buying the whole amount.

My initial "virtual" investment is 1000 USDT at the start of the year and, then I found 19 signals of BUY/SELL order:
Putting the "Gains" in a chart:
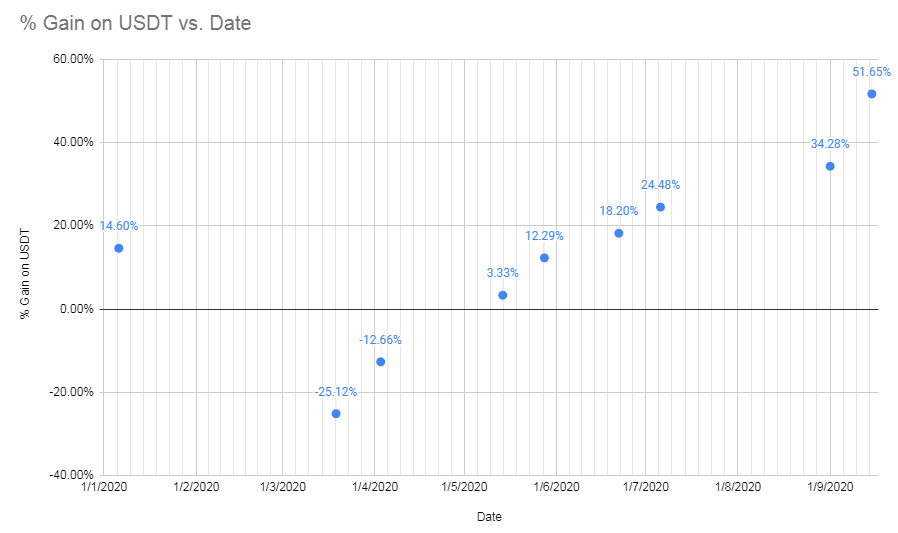
As you can see, from the initial investment, 1000 USD, after 9 moths of "running" this strategy we should have managed to get 1516 USD or 51.6% Profit... which is not bad for a "Passive Income" of an automatic process.
The thing here is that if we would buy BTC in the first signal but keep it without selling it till the top price of 12040 USD, we should get today 1736 USD... but, you know, this are things you can never know about the future.
RSI Trading strategy looks a very reliable tool at least for the moment, I guess I should need more signals and historical data in the chart to get more consistent conclusions but I would like to see the comparison with other Trading Indicators as the Bollinger Bands or the Moving Averages strategy.
Hope you have enjoy it.
Other Related Posts:
- Candlestick Patterns: How efficient is the Bullish Engulfing Pattern on BTC trading?
- Candlestick Patterns: How efficient is the Bullish Hammer Candlestick on BTC trading?
- Candlestick Patterns: How efficient is the "Inverted Hammer" Candlestick on BTC trading?
I'm sharing only my quick trading Ideas here, not financial advice at all ;-)
@toofasteddie
*Disclaimer: This is just my personal point of view, please, do your own assessment and act consequently. Neither this post nor myself is responsible of any of your profit/losses obtained as a result of this information.

