


The lead crypto Bitcoin (BTC) is edging south from its freshly logged multi-year high of $19,915. The positive sentiment seems to be taking a breather as the momentum indicators lose some traction. Downside risks dominated Bitcoin (BTC) against the US Dollar on Friday as a result the exchange rate declined to $17,580. Despite the recent downside pullback over the last couple of days, BTC traded in a confined range of $19,432 and $17,580. BTC/USD registered an intraday high of $18,293 as dip-buyers continue to show strong interest. The Bitcoin (BTC) market cap is currently $333 billion, with $27.88 billion traded in the past 24 hours. The current spot price is down 1.57% in 24hrs while currently trading at $17,967. Bitcoin is flowing out of crypto exchanges as seen in a declining Bitcoin Exchange Balance. On-chain analytics firm glassnode noted that the total amount of Bitcoin on exchanges has declined to 2.3 million BTC, the lowest level seen since July 2018.
*Downside risks dominated Bitcoin (BTC) against the US Dollar on Friday as a result the exchange rate declined to $17,580
*BTC/USD registered an intraday high of $18,293 as dip-buyers continue to show strong interest
*Bitcoin is flowing out of crypto exchanges as seen in a declining Bitcoin Exchange Balance
Key Levels
Resistance Levels: $20,500, $19,500, $18,500
Support Levels: $17,500, $16,200, $15,000
BTC/USD Daily Chart: Ranging
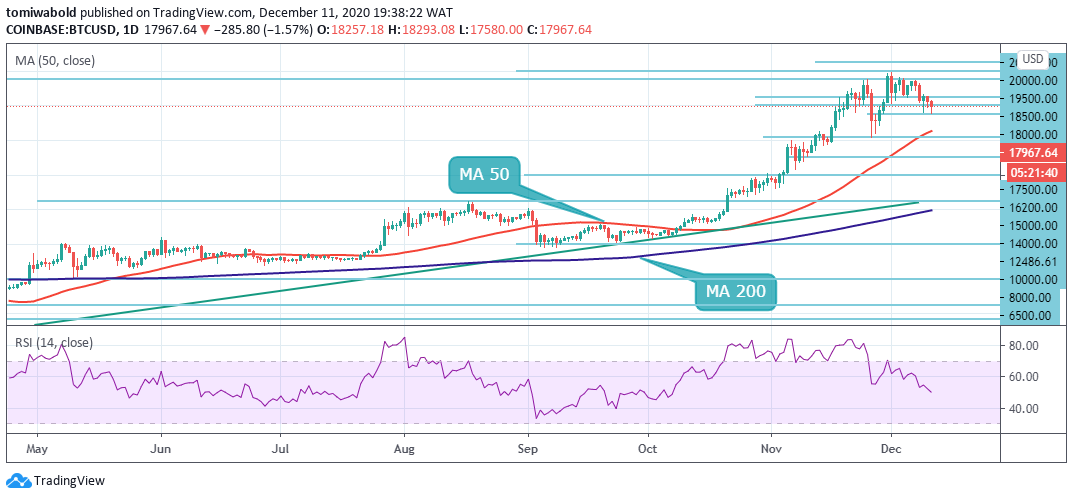 BTC/USD Daily Chart
BTC/USD caved into selling pressure that held once again around the tough $18,500 ceiling, falling back to test beneath the $18,000 horizontal support zone. The lead crypto is searching for formidable support towards the MA 50 zone at $16,500. This may be the likely scenario if BTC was rejected at $18,500 and closed the day under $18,000.
Massive sell orders are expected to be triggered if Bitcoin breaks under the levels mentioned above. Sharp declines will come into play, adding credibility to the bearish outlook targeting $16,000. The MA 50 stays in the positive region, while the RSI is exhibiting decline to its midline which signals a divergence hence a stalled positive picture. Any such rebound may probably set Bitcoin on a pathway to $19,000.
BTC/USD 4-Hour Chart: Ranging
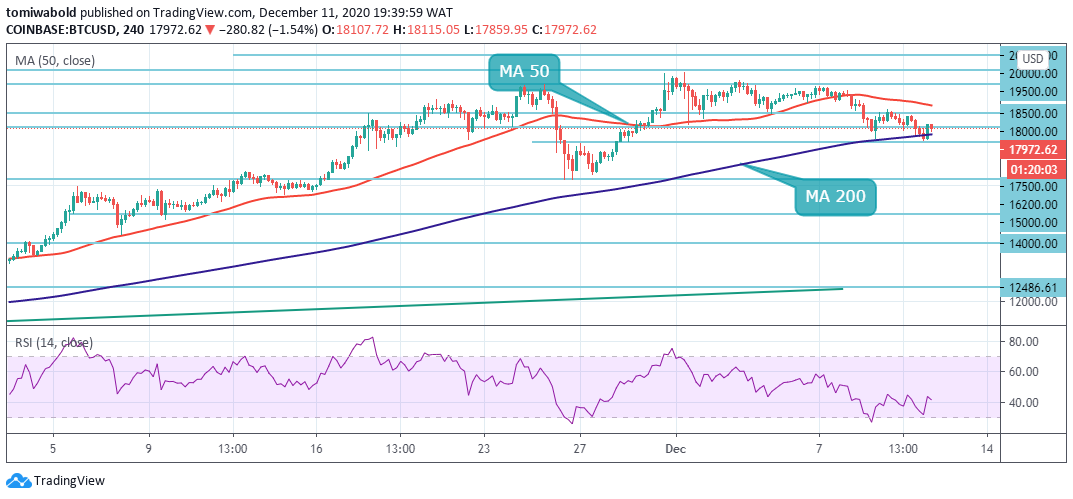
On the shorter time frame, the trend shift towards consolidation is clearer as BTC/USD is starting to range between 4 hour MA 50 and MA 200 around the $18,000 level while dip-buyers continue to show strong interest. The lower time frame analysis shows that the BTC/USD pair has now completed the structure formation of a large inverted head and shoulders pattern.
It is worth mentioning that BTC/USD may resume the uptrend if support at the 4 hour MA 200 holds firmly. Closing the day above, $18,000 may save buyers from an extended breakdown to $16,000. The BTC/USD pair is only bullish while trading above the $18,000 level, key resistance is found at the $18,500 and the $19,500 levels. If the BTC/USD pair trades below the $18,500 level, sellers may test the $17,500 and $16,200 levels.
Note: Kryptomoney.com is not a financial advisor. Do your research before investing your funds in any financial asset or presented product or event. We are not responsible for your investing results
Image Credit: Shutterstock