


The Bitcoin (BTC) price has fallen since its yearly high in July.recently broke down from a long-term ascending support line.
The weekly timeframe readings and price action are decisively bearish, supporting the possibility of more downside.
Bitcoin Price Falls After Rejection at Long-Term Resistance
The technical analysis for the weekly timeframe gives conclusively bearish signs. The main reason for this is the deviation above the $30,000 resistance area and the subsequent decrease below it (red icon). This created a long upper wick, a sign of selling pressure.
After the rejection, BTC broke down from an ascending support line. Since the line had been in place since the beginning of the year, the BTC price breakdown was considered a significant bearish development. BTC now trades only 6% above the $24,500 horizontal support area.
Stay ahead in the game with Bitcoin (BTC) price forecasts.
Despite the bearish price action, the news is mostly positive. While the Securities and Exchange Commission (SEC) postponed the verdict on Bitcoin ETF applications, analysts are positive that the ETF approval will come this year.
Additionally, Google is expanding its cloud operations to El Salvador, which sparked speculation about a Bitcoin-related motive.
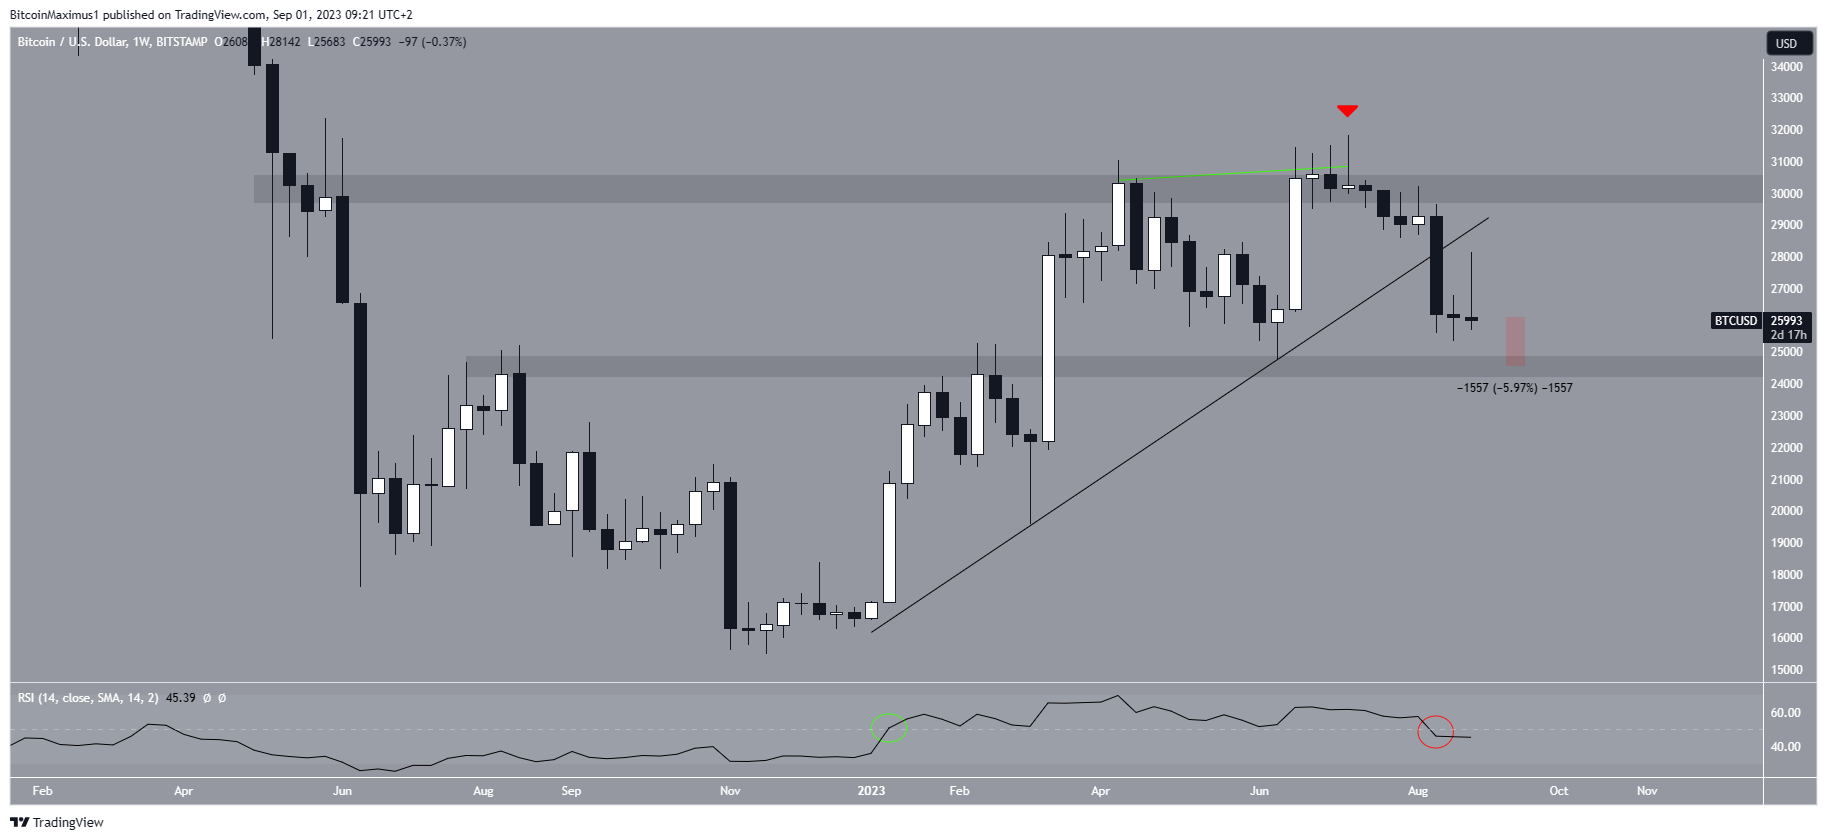
The weekly is decisively bearish. With the as a momentum indicator, traders can determine whether a market is overbought or oversold and decide whether to accumulate or sell an asset.
Bulls have an advantage if the RSI reading is above 50 and the trend is upward, but if the reading is below 50, the opposite is true. The indicator just moved below 50 (red circle).
This is the first time it has done so since the beginning of the year (green circle), when it created the ascending support line. This bearish sign further validates the breakdown and suggests that more downside is expected.
Everything You Need To Know About Bull Flag Patterns
BTC Price Prediction: Will Breakdown Lead to More Downside?
Similarly to the weekly timeframe, the daily one suggests more downside is expected.
The price has fallen under a descending resistance line since the yearly high. The failure to break out is considered a bearish sign that can lead to more downside.
Secondly, the daily RSI has generated a bearish divergence (green line). The trendline of the divergence is still intact and coincides with the price rejection from the resistance line.
Finally, the wave count suggests that the price is in the fifth and final wave of a downward movement. Technical analysts employ the Elliott Wave theory to determine the direction of trends. This methodology involves examining repetitive long-term price patterns and assessing investor psychology.
If the count is correct, the price will complete the fifth wave near the 0.5 retracement support level at $23,600.
Despite this bearish BTC price prediction, a breakout from the descending resistance line will mean the correction is over, and the trend is still bullish. In that case, the price can move toward its yearly high of $31,800.
Check out the Best Crypto Sign-Up Bonuses in 2023