


Data shows that Bitcoin transactions have grown in number recently, but exchange deposit and withdrawal transfers have only moved sideways.
Bitcoin Transaction Count Has Observed A Sharp Increase Recently
According to data from the on-chain analytics firm Glassnode, the BTC blockchain activity has significantly gone up recently. The indicator of interest here is the “transaction count,” which measures the total number of Bitcoin transactions taking place on the network right now.
When the value of this metric is high, it means the chain is seeing a high amount of usage from the holders. This kind of trend suggests traders are active in the market right now.
On the other hand, low values of the indicator suggest the BTC blockchain is seeing low activity currently. Such a trend can be a sign that the general interest in the asset is low among investors at the moment.
Now, here is a chart that shows the trend in the Bitcoin transaction count over the last few years:
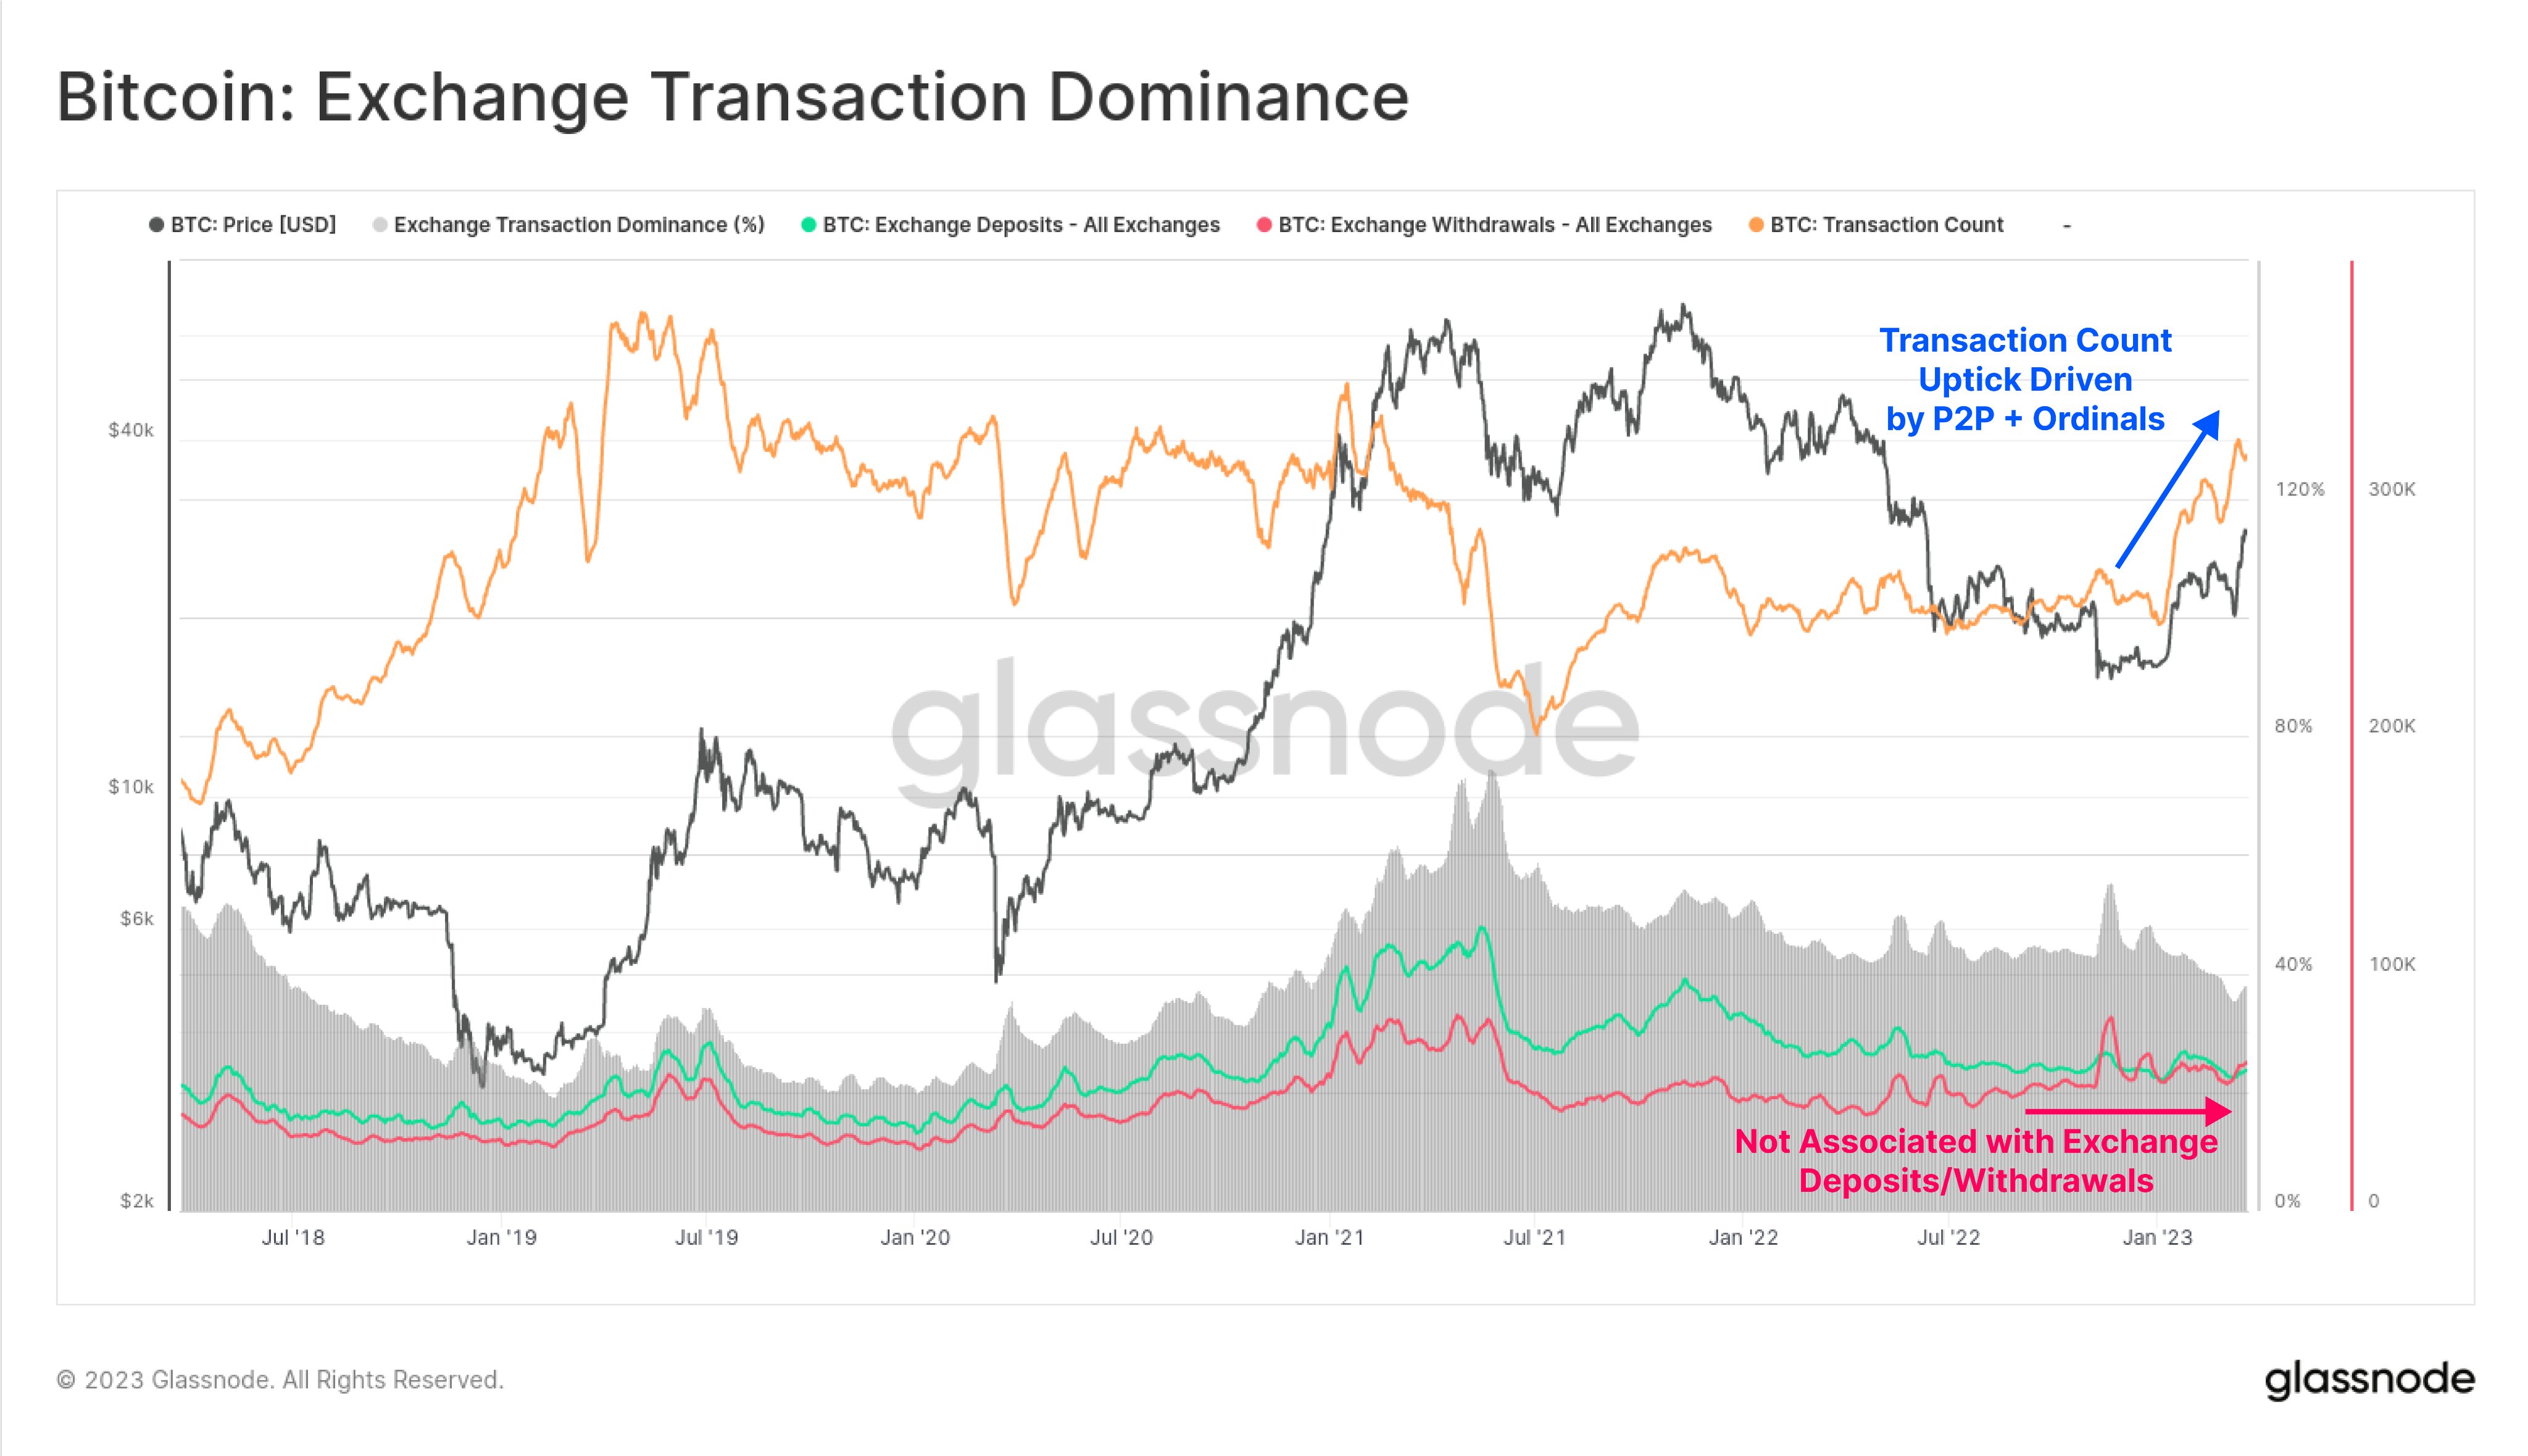
The value of the metric seems to have seen a sharp rise in recent weeks | Source: Glassnode on Twitter
As shown in the above graph, the Bitcoin transaction count had gone stale after the plunge where the cryptocurrency had descended from the bull rally top. This trend remained true throughout the bear market until the rally started this year.
With this fresh price surge, the indicator has shot up and has hit levels that were only last seen during the bull run in the first half of 2021. This means that the number of transfers taking place on the chain right now is the highest in about two years.
The chart also shows data for two other indicators, the Bitcoin exchange deposits and exchange withdrawals. As the names of these metrics already imply, they tell us about the total amount of transfers going in and out of exchanges, respectively.
These metrics are not to be confused with the inflow and outflow indicators, as the latter ones measure the total number of coins flowing into and out of exchanges, rather than the transaction count.
From the graph, it’s visible that despite the spike in the Bitcoin transaction count, these two metrics have continued to move sideways. This means that the increase in transfers has almost entirely come from the peer-to-peer (P2P) side and not exchanges.
This is unlike what was seen during the April 2019 rally and 2021 bull run, where the exchange-related transactions also saw at least some rise along with the price increase.
Since the Ordinals protocol, a method of inscribing data directly into the Bitcoin blockchain (basically the BTC version NFTs), has also seen emergence during the recent months, part of the increase in the transaction count is likely driven by such transfers made using this protocol.
At the time of writing, Bitcoin is trading around $28,200, up 14% in the last week.
BTC hasn't moved much recently | Source: BTCUSD on TradingView