


Bitcoin (BTC) Price Prediction – March 18
At the moment, BTC/USD trades at $5,208 after retreated from an intraday high above $5,465 as the upside momentum faded away.
BTC/USD Long-term Trend: Bearish (Daily Chart)
Key levels:
Resistance Levels: $6,400, $6,600, $6,800
Support Levels: $4,000, $3,800, $3,600

Since a couple of days ago, BTC/USD has been moving in a tight range around the lower boundary of the Bollinger bands and it is currently slipping below 9-day moving average at $5,208 after touching $4,998.90, which is a worrying signal. The next support is seen at $4,900 and there is hope that the sell-off will be contained here. If it is broken, as the technical indicator RSI (14) is still within the oversold territory, the sell-off may gather pace and take the price towards $4,600.
Nevertheless, BTC/USD may need to return above $5,200 to mitigate the initial pressure and bring $5,400 back into play. Once it is out of the way, the upside is likely to gain traction with the next focus on $6,000 (March 15 high is at $5,968) and $6,100. Recovery is needed above $6,000 to pave the way for more action leading towards $7,000 but with the look of things, BTC/USD is not technically ready.
Moreover, the Bitcoin price is starting to range above $5,000 with an immediate upside limit of $5,500. The regained stability follows the recovery from Monday’s dip under $5,000. However, the bulls lack the energy to maintain gains above $5,500 and may not be able to tackle the critical level at $6,000. In other words, if $6,000 comes into focus, the price may likely reach the resistance levels at $6,400, $6,600 and $6,800 but if not, the support levels of $4,000, $3,800 and $3,600 may be visited.
BTC/USD Medium – Term Trend: Ranging (4H Chart)
Following the yellow trend line, the 4-hour chart clearly shows that buyers are in control especially with the price above the 9-day moving average. The middle boundary of Bollinger bands is now in line to offer support if the price reverses from levels above $5,300. The technical indicator RSI (14) has been forming a higher high pattern since the recovery from levels under $5,000. Stability is likely to take precedence if the RSI (14) stays above 50.
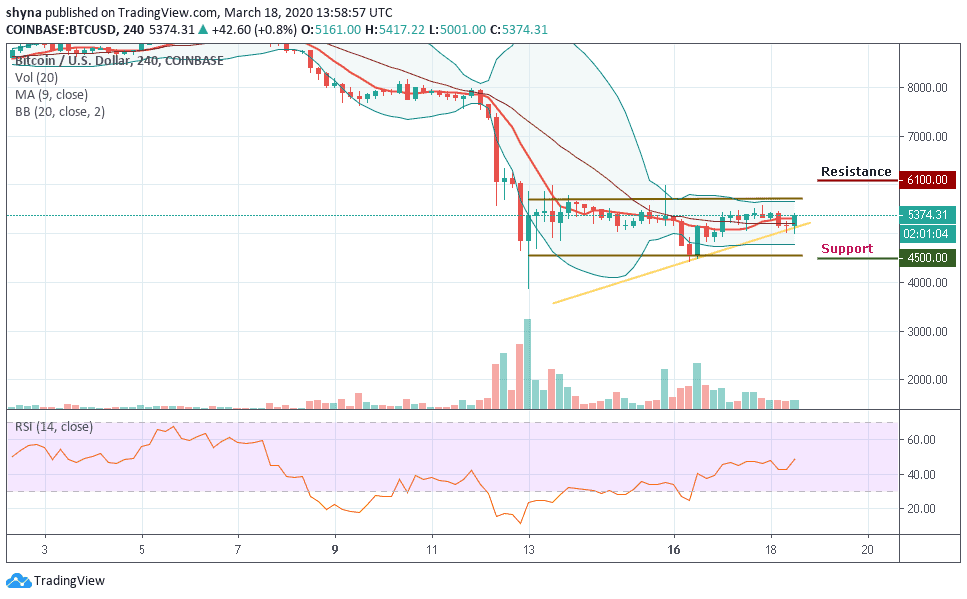
However, if Bitcoin bulls manage to retake the support at $5,500, the move could boost the price towards $6,000. But with the look of things, BTC/USD is not fundamentally ready for a rally and the range between $5,000 and $6,000 could stay in place for a short while. Meanwhile, the resistance levels to watch for are $6,100 and $6,300 while the support levels to watch for are $4,500 and $4,300 respectively.
Please note: Insidebitcoins.com is not a financial advisor. Do your research before investing your funds in any financial asset or presented product or event. We are not responsible for your investing results.