


Bitcoin (BTC) Price Prediction – March 26
The Bitcoin price dropped slightly today but it is finding some form of support at the $6,505 level.
BTC/USD Long-term Trend: Bullish (Daily Chart)
Key levels:
Resistance Levels: $8,000, $8,200, $8,400
Support Levels: $5,500, $5,300, $5,100

Today, BTC/USD jumped ahead and faced a key resistance of $6,808 but was later rejected and now trading sideways. However, if BTC/USD continued to consolidate in this way, traders could soon see it breaking through the above-mentioned level of key resistance and it would then be obvious to target $7,000. More so, we could see a larger decline for the next two days if the downtrend continues to form in a pattern formation.
Currently, the market price for BTC/USD and the daily candle is trading above the 9-day and 21-day moving averages at $6,808 but if the bulls could push the price above the channel, the next resistance levels may be found at $8,000, $8,200 and $8,400. Typically when the uptrends are beginning to stand firm, traders will use the 9-day moving average as the nearest support level.
However, should in case the bulls fail to move the price up, we may see a price cut to $6,000 vital support. A further low drive could send the price to $5,500, $5,300 and $5,100 supports. For now, looking at the daily chart, the bulls are still defending critical support. But as things stand, the BTC/USD price may likely reverse again because the stochastic RSI is still moving within the overbought condition.
BTC/USD Medium-Term Trend: Ranging (4H Chart)
On the 4-Hour chart, BTC/USD trade in sideways. Nevertheless, the coin has not yet slipped below $6,500 and still in the loop of breaking above the moving averages. For now, BTC price hovers around $6,717 and may take time to persistently trade above $7,000 but the upward movement could near the $7,100 and $7,300 resistance level if the bulls regroup.
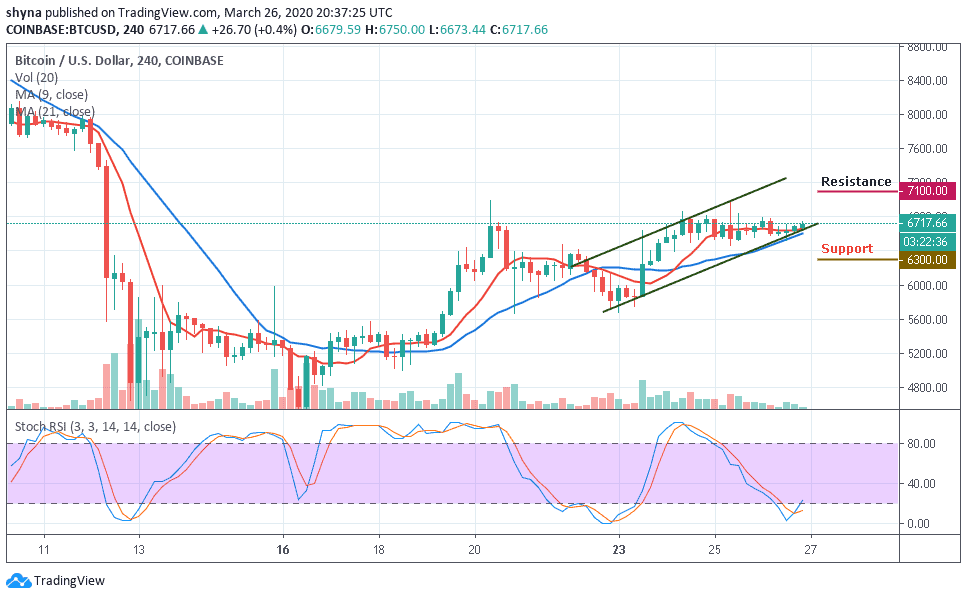
However, on the downside, immediate support is around the $6,600 level while the main support is at the $6,500 level. The price may likely fall below $6,400 if the bears step back into the market, a further bearish movement could test the critical support at $6,300 and $6,200 respectively. Meanwhile, the stochastic RSI is about moving out of the oversold zone, which may likely bring more bullish signals into the market soon.
Please note: Insidebitcoins.com is not a financial advisor. Do your research before investing your funds in any financial asset or presented product or event. We are not responsible for your investing results.