


Bitcoin (BTC) Price Prediction – March 7
BTC/USD begins another breakdown and the price could hit $8,600. The sells-off has resumed as Bitcoin price faces a fresh round of selling below $9,000 against the US Dollar.
BTC/USD Long-term Trend: Bullish (Daily Chart)
Key levels:
Resistance Levels: $9,900, $10,100, $10,300
Support Levels: $8,300, $8,100, $7,900

BTC/USD resumed back into a selling mode, after an erratic recovery during the previous days. Early this morning, the coin topped at $9,255 and has been in retreat ever since. At the time of writing, BTC/USD is trading at $8,901, down 2.81% since the price touched the 21-day moving average. Bitcoin continues to narrow down towards the 9-day moving average. The downtrend is clearly shown by taking a broader technical picture using the daily chart.
Moreover, the BTC/USD price is struggling to hold a couple of important supports near $8,500. The price is likely to continue lower below the $8,300 and $8,100 support level. If there is a downside break below the $8,100 support level, the price could visit the $7,900 support level. The bears are gaining momentum and if the price clears the $7,900 support, there is a risk of a sharp decline to $7,700 support levels.
In addition, the market is deciding between the 9-day and 21-day moving averages, where the buyers are anticipating a rebound. Meanwhile, the $9,200 and $9,400 levels may further surface as critical resistances should the $9,600 level holds. However, a strong bullish spike might take the price to $9,900, $10,100 and $10,300 levels. But presently, the RSI (14) is below the 45-level.
BTC/USD Medium – Term Trend: Bullish (4H Chart)
Following the 4-hour chart, Bitcoin bears are now pushing the price below its previous support level that existed around $8,900. Although, the Bitcoin price has not yet slipped below $8,800 and it’s still in the loop of making a bounce back. Its price hovers around $8,894 and may take time to persistently trade above $9,000.
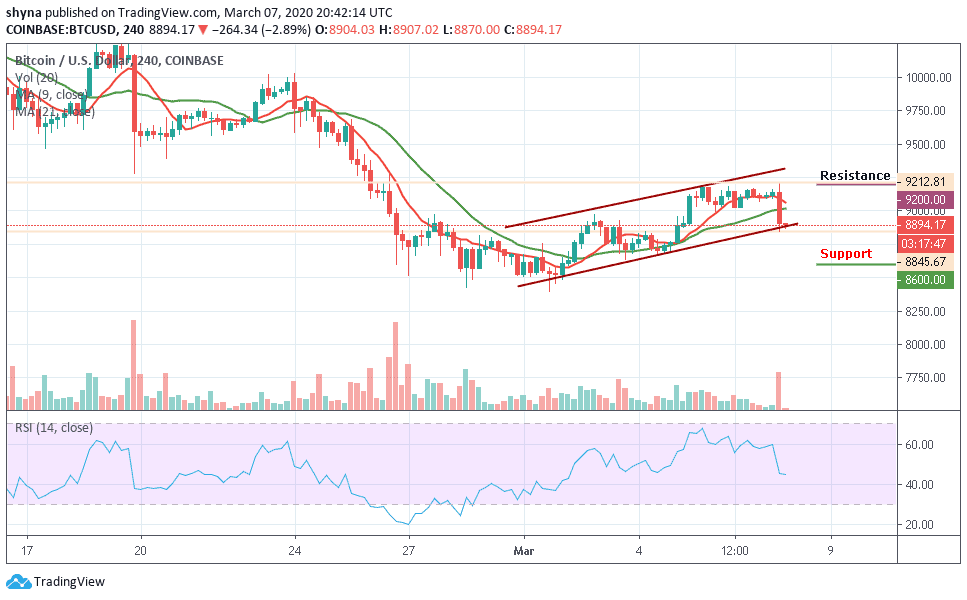
Nevertheless, BTC/USD is currently moving below the 9-day and 21-day moving averages and any upward movement may likely push the price near the $9,200, $9,400 and $9,600 resistance levels while the immediate support lies at $8,600, $8,400 and $8,200. The RSI (14) nosedives and moves around 44-level, which may likely give more bearish signals before a reversal could play out.
Please note: Insidebitcoins.com is not a financial advisor. Do your research before investing your funds in any financial asset or presented product or event. We are not responsible for your investing results.