


Bitcoin price is trying to contain the losses above $9,500 after an attempted breakout over the weekend got snapped at $10,000. The downtrend could not find support at $9,800 at the same time, $9,600 recently gave in to the increased selling activity. Bitcoin is trading at $9,580 after correcting lower 0.82% during the Asian session on Tuesday.
Bull Flag Breakout In The Making
The rejection at $10,500 followed by a lower high and lower low patter has resulted in the formation of a bull flag pattern. Bulls appear to be losing control of the price in the near term. However, flag patterns have been known to culminate in the continuation of the prior pattern. In this case, BTC/USD’s uptrend to $10,500. A breakout above the flag’s resistance coupled with a higher volume, fundamentals and positive change in sentiments could send Bitcoin price not only above $10,000 but also catapult it towards $11,000.
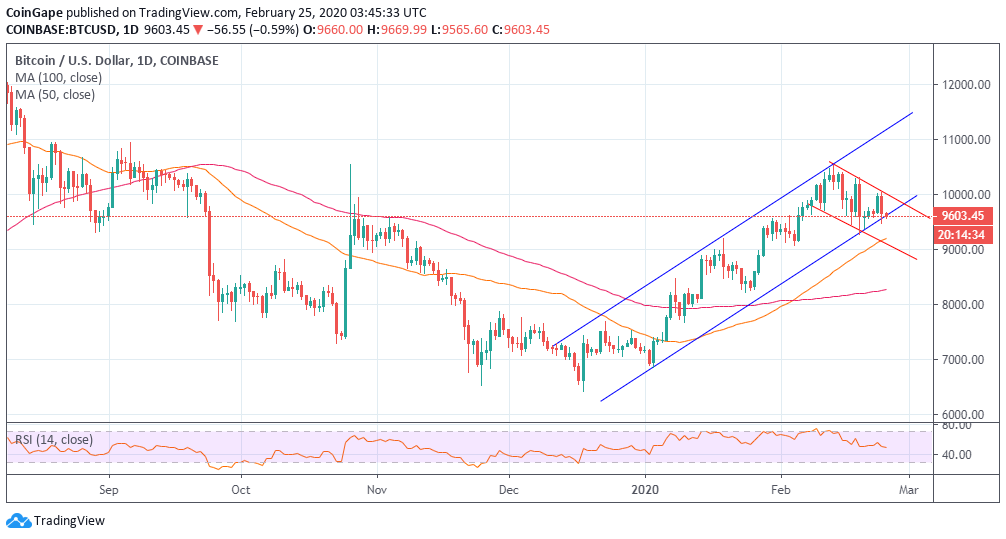
BTC/USD daily chart
Bitcoin Price Technical Picture
According to applied technical indicators on the daily chart, Bitcoin is likely to extend the break below a two-month-long ascending trendline. With the RSI sinking fast towards 30 (oversold region) there is a possibility that bearish pressure will continue to hover a while longer. Moreover, the widening gap between the 100-day SMA and the 50-day SMA clearly shows that the bears are comfortable in the driver seat. Support is expected at $9,500, $9,300 as well as $9,000.
Bitcoin Key Levels
Spot rate: $9,592
Relative change: -71.84
Percentage change: -0.74%
Trend: Bearish
Support: $9,500, $9,300 and $9,000
Resistance: $9,800 and $10,000