


Bitcoin is in the middle of a retracement move from last week’s high above $10,500. The downward momentum has become quite unstoppable. Besides, the key support at $9,700 has been ravaged forcing the bulls to concentrate on defending the next support target at $9,600.
Bullish Flag Pattern
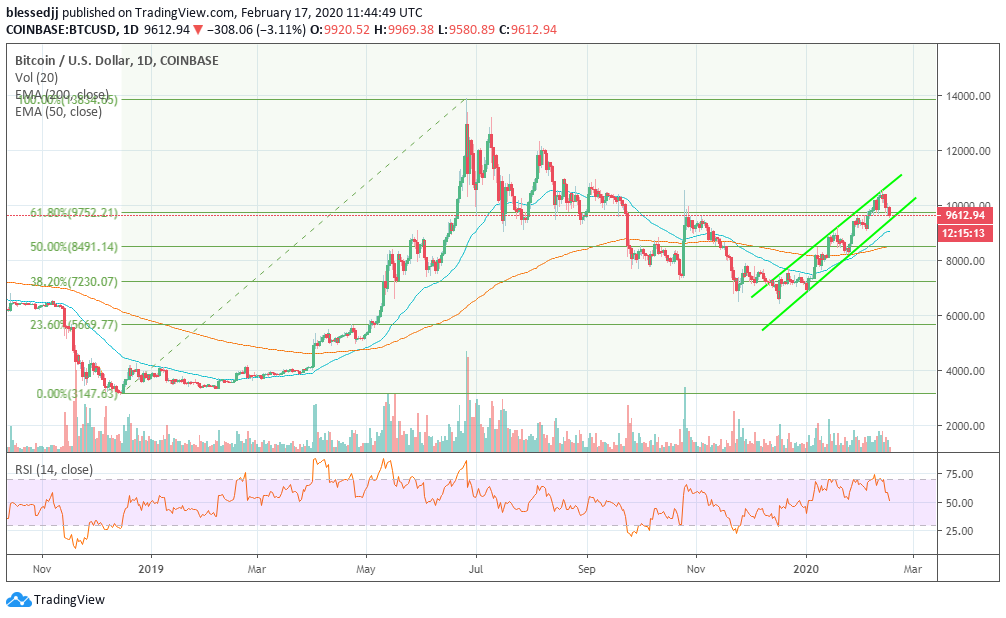
The formation of a bullish flag pattern suggests the more upside action could continue only if the pattern’s support is not broken. However, a breakdown under the flags support could result in dire effects of Bitcoin price spiraling towards $9,000.
BTC/USD daily chart
All technical indicators support the bearish motion, further drumming home the idea that this could be the end of Bitcoin’s bull rally. The RSI, for example, is almost digging under the average (50). The sharp downward slope is a clear indication of the influence and the force sellers are exerting on the tentative support areas.
On the brighter side, BTC/USD is still trading above the 200-day SMA. Moreover, the 50-day SMA is above the 200-day SMA to show that buying power is not entirely non-existent. However, the bulls require a boost to come out of the bears’ trap. A reversal is possible but only if the support at $9,700 is reclaimed. Besides the next support at $9,600, Bitcoin will seek balance at lower areas such as the 9,200, $8,800, the 50% Fibonacci retracement level and $7,200.
Bitcoin Key Levels
Spot rate: $9,609
Relative change: -310
Percentage change: -3.13%
Trend: Strongly bearish
Volatility: High
DisclaimerThe views, opinions, positions or strategies expressed by the authors and those providing comments are theirs alone, and do not necessarily reflect the views, opinions, positions or strategies of CoinGape. Do your market research before investing in cryptocurrencies. The author or publication does not hold any responsibility for your personal financial loss.
- bitcoin (BTC)
- Bitcoin Price Analysis
- BTCUSD