


Bitcoin price continues to extend the consolidation period after it hit a snag slightly under $9,900 during the weekend session. It became difficult to hold above $9,800, instead, the price tumbled on Monday to test the support at $9,600. In spite of the drop, Bitcoin is trading way above the consolidation support zone at $9,400. Moreover, its immediate downside is supported by the 50 Simple Moving Average (SMA).
False Triangle Breakout?
Looking at the 4-hour chart, we can see an attempt by the bulls for a breakout past the falling triangle pattern (in blue) resistance failed to make the cut. While they succeeded in the break, the price action did not give the desired results because BTC/USD reversed the trend almost immediately. The impact of the triangle breakout is still possible as long as more bulls join the market to build up the volume to sustain gains towards $10,500 and $11,000.
The triangle pattern breakout is expected to gain more traction on overcoming the hurdle at the consolidation resistance (red line). This would give the bulls energy to push for gains above $10,000.
BTC/USD 4-hour chart
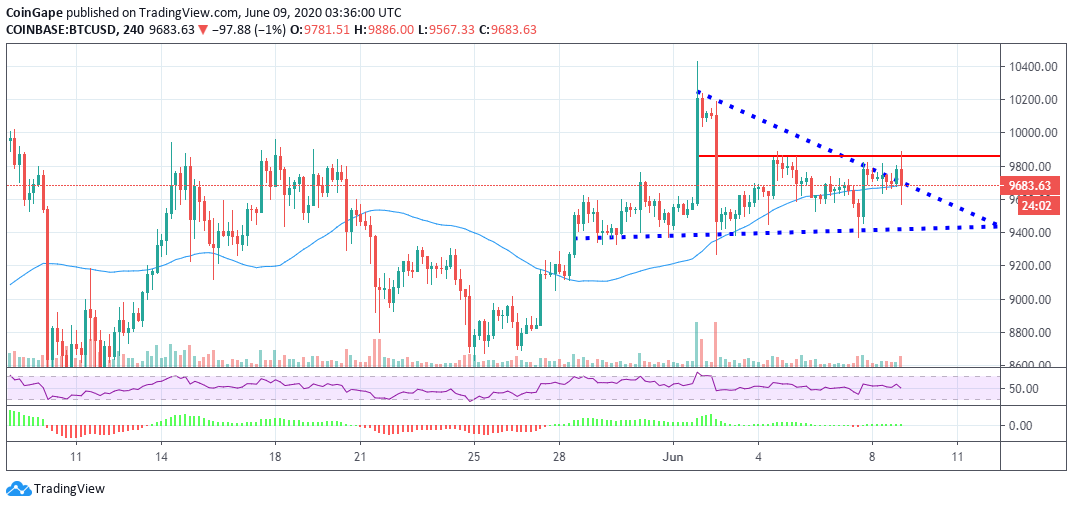
Meanwhile, BTC/USD is trading at $9,676 while facing increased selling activity. The Relative Strength Index (RSI) is almost sliding under the average (at 50). If support at $9,600 gives it, BTC could spiral further to the consolidation support. However, the slide is likely to allow more buying entries from investors who desire to buy low while targeting $10,500 and $11,500.
Bitcoin intraday Key Levels
Spot rate: $9,676
Relative change: -100
Percentage change: -1%
Trend: Short term bearish
Volatility: Low