


Bitcoin succumbed to more selling action during the weekend session. The price extended the bearish action from last week’s resistances between $9,200 and $9,300 to levels slightly above $8,600. At the time of writing, Bitcoin is valued at $8,761 after a minor recovery. Intraday gains have pushed above $8,800 but the momentum is still not sustainable.
Bulls are focusing on $9,000 in the near term. This level would give them the opportunity to shift the focus towards $10,000. Meanwhile, the prevailing technical still leans towards bearish. For instance, the Relative Strength Index (RSI) slipped under the average (50) and currently is entertaining a sideways motion. If the indicator’s trend remains unaltered, there is a possibility for the price to consolidate between $8,700 and $8,900.
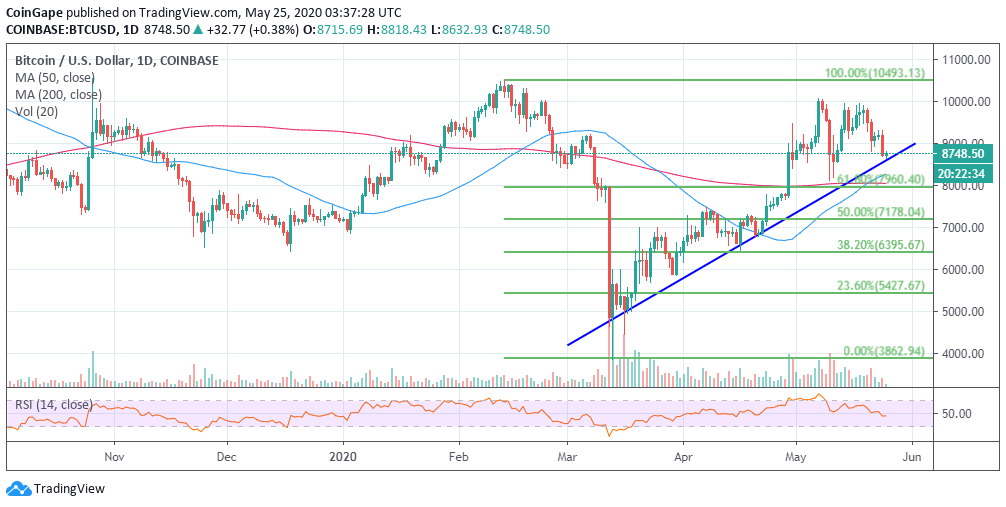
BTC/USD daily chart
From a different technical point of view, the bulls have the upper hand. The 50-day SMA is widening the gap above the long term 200-day SMA. In other words, this shows that bulls have more influence. Moreover, the high volatility and expanding volume could eventually pull BTC/USD above $9,000.
As far as support is concerned, Bitcoin price is holding above the key trendline. The moving averages; 50 SMA and the 200 SMA are ready to keep the bears at bay with the aim of averting losses under $8,000. Other areas that could be of interest to the buyers include the 61.8% Fibonacci level and $7,000 (both regions could be great incision points for BTC).
Bitcoin Intraday Key Levels
Spot rate: $8,761
Relative change: 46.12
Percentage change: 0.53%
Trend: Bullish
Volatility: High
High: $8,817
Low: $8,637