


Bitcoin price has been dealing with extreme volatility levels mainly driven by the fear caused by the Coronavirus pandemic. However, the digital asset appears to be gaining resilience based on the recovery moves it pulled on Friday and Monday. Last week, the Bitcoin price broke above a key resistance zone at $6,000. Impressive upside action approached the critical $7,000 zone. Unfortunately, a breakout did not materialize, leaving BTC/USD vulnerable to losses under $6,000.
Bitcoin Price Bullish Scenario
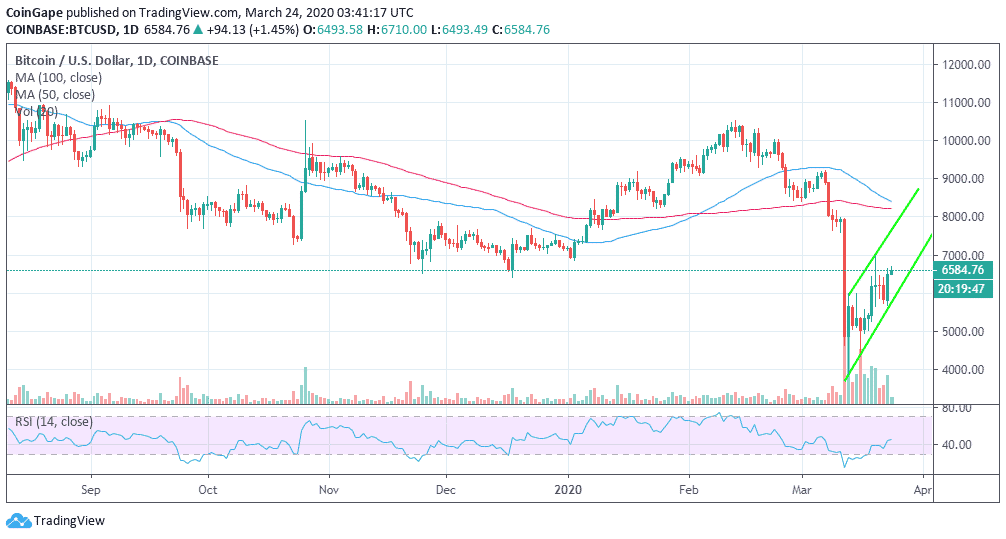
At the time of writing, BTC/USD is trading at $6,576 after adding over 1.5% of gains on Tuesday. The Asian hours have been characterized by increased buying entries, however, it is still not enough to sustain movement towards $7,000.
Generally, Bitcoin price trend remains in the able hands of the bulls. This is emphasized by the up-trending Relative Strength Index (RSI). The indicator has since the crash to levels under $4,000 formed a higher high pattern. With the RSI under the average, room for growth is plenty as long as the buying volume increases steadily throughout the week.
BTC/USD daily chart
The zone at $7,000 has been tested once, making it a critical area. If BTC/USD steps above it, buyers could get a boost as the focus shifts to $8,000. On the other hand, failure to clear the resistance could result in exhaustion of the bulls and a bearish action back to $6,000. Despite the bullish momentum, selling pressure cannot be ignored especially if the 50-day SMA continues to close the gap towards the 200-day SMA.
Bitcoin Key Levels
Spot rate: 6,576
Relative change: 85
Percentage change: 1.20%
Trend: Bullish
Volatility: Shrinking