


Bitcoin bulls are finally in control following a break not only above $7,000 but also $7,400. Advancement from the $6,000 range has taken a long time with several barriers at $6,400, $6,800 and $7,000 standing in the way. However, BTC/USD is now trading at $7,365 (on Coinbase). Intraday metrics show the price having added over 2% on its value on the day following a correction from $7,201 (opening value).
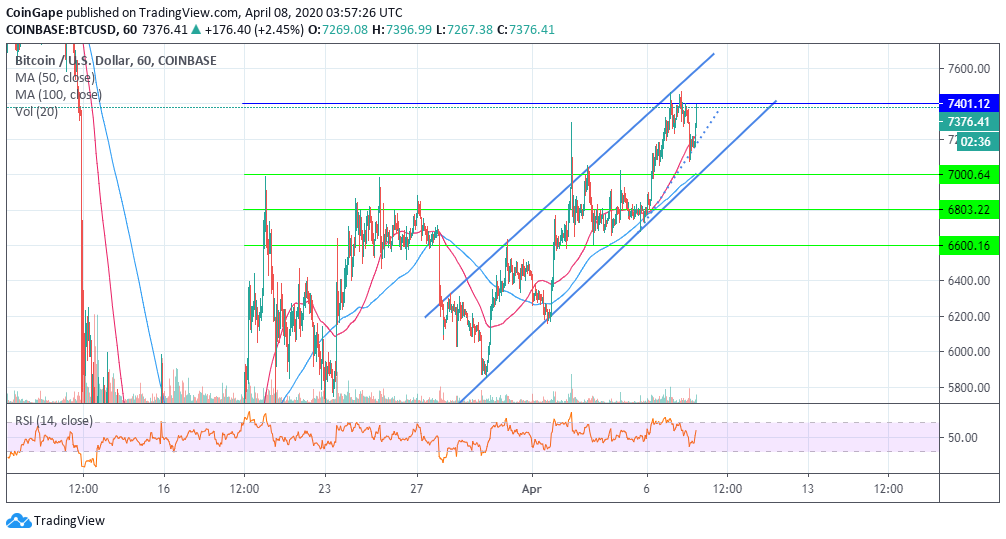
The main mission for the bulls is to push for gains above $7,400. This could increase the investors and trader confidence in the recovery, targeting $8,000. Looking at the 1-hour chart, BTC/USD is trading above the moving averages. The 50 SMA is in line to offer support at $7,225 and the 100 SMA is holding the ground at $7,387.
BTC/USD 1-hour chart
Bitcoin price has in the past one week nurtured an uptrend within an ascending channel. The channel resistance continues to cap movement to the north at the same time, channel support is functioning as a bounce wall in support of the bullish trend.
The Relative Strength Index (RSI) is pointing sharply upwards to show that buyers are in the driver’s seat and are not afraid to step on the throttle. The widening gap between the 50 SMA and the 100 SMA also doubles down on the increasing buying activities. It is just a matter of time before Bitcoin goes back to trading above $7,400 and eventually reaching out towards $8,000.
Bitcoin Key Intraday Levels
Spot rate: $7,365
Relative change: 160
Percentage: 2.24%
Trend: Bullish
Volatility: Low