


After Bitcoin was rejected from the levels above $10,000 last week, it embarked on crucial journey in search of a formidable support area that would enable gains to be technically supported. BTC/USD initial struggled to clear the hurdle at $9,000 until mid this week when the bullish leg extended the action above $9,300. The largest cryptocurrency had the intension of drawing near to $9,500, but lost steam short of $9,400.
Meanwhile, BTC/USD is trading at $9,320 amid a building bullish momentum. All eyes are glued to the coveted $10,000 level but various seller congestion zones must come down first. The technical picture is positively intact with the Relative Strength Index gradually ascending towards the overbought. Recovery from near oversold levels experienced over the weekend shows that it’s the bulls’ turn.
BTC/USD 4-hour chart
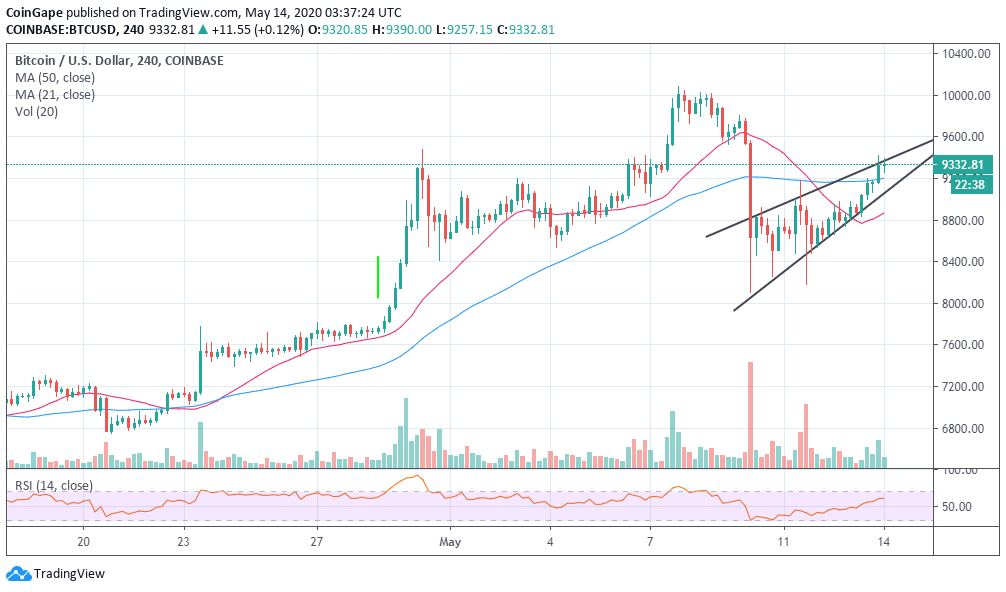
Bitcoin is first support at $9,300, however, the key support lies with the 50 Simple Moving Average (SMA) currently at $9,200. Other areas of interest to the buyers include $9,000, the 100 SMA currently at $8,868, $8,800 and $8,400.
Although the prevailing picture is bullish, the formation of a rising wedge pattern could jeopardize the effort put in by the buyers. A rising wedge pattern is used in classical technical analysis to show a reversal (usually bearish) after an extended bullish action. Unless Bitcoin makes above $9,500 and focus on $10,000, the impact of the pattern could be devastating and even result in a crash under $9,000.
Bitcoin Intraday Key Levels
Spot rate: $9,345
Percentage change: 0.26%
Relative change: 24
Trend: Bullish
Volatility: Expanding