115
115
BTC fell by 3.5% today after rolling over from the critical resistance area at 35-36K. As mentioned here yesterday, bitcoin was facing huge resistance upon a mid-term descending trend line, along with the 20-day MA. This led to a breakdown of the short-term ascending price channel that BTC was trading within.
In addition to this, the daily RSI saw another rejection at a major descending trend-line of lower highs (bearish) that started forming in February 2021.
On top, there is another concern for the bulls – the weekend rally was fueled by a very minimal trading volume (as can be seen below). In fact, it was the lowest seen since early May:
As a reminder, we have to see volume levels return to the market for a real bullish breakout. This might explain the correction we are witnessing now, as the bullish weekend wasn’t sustained in terms of sufficient buying volume.

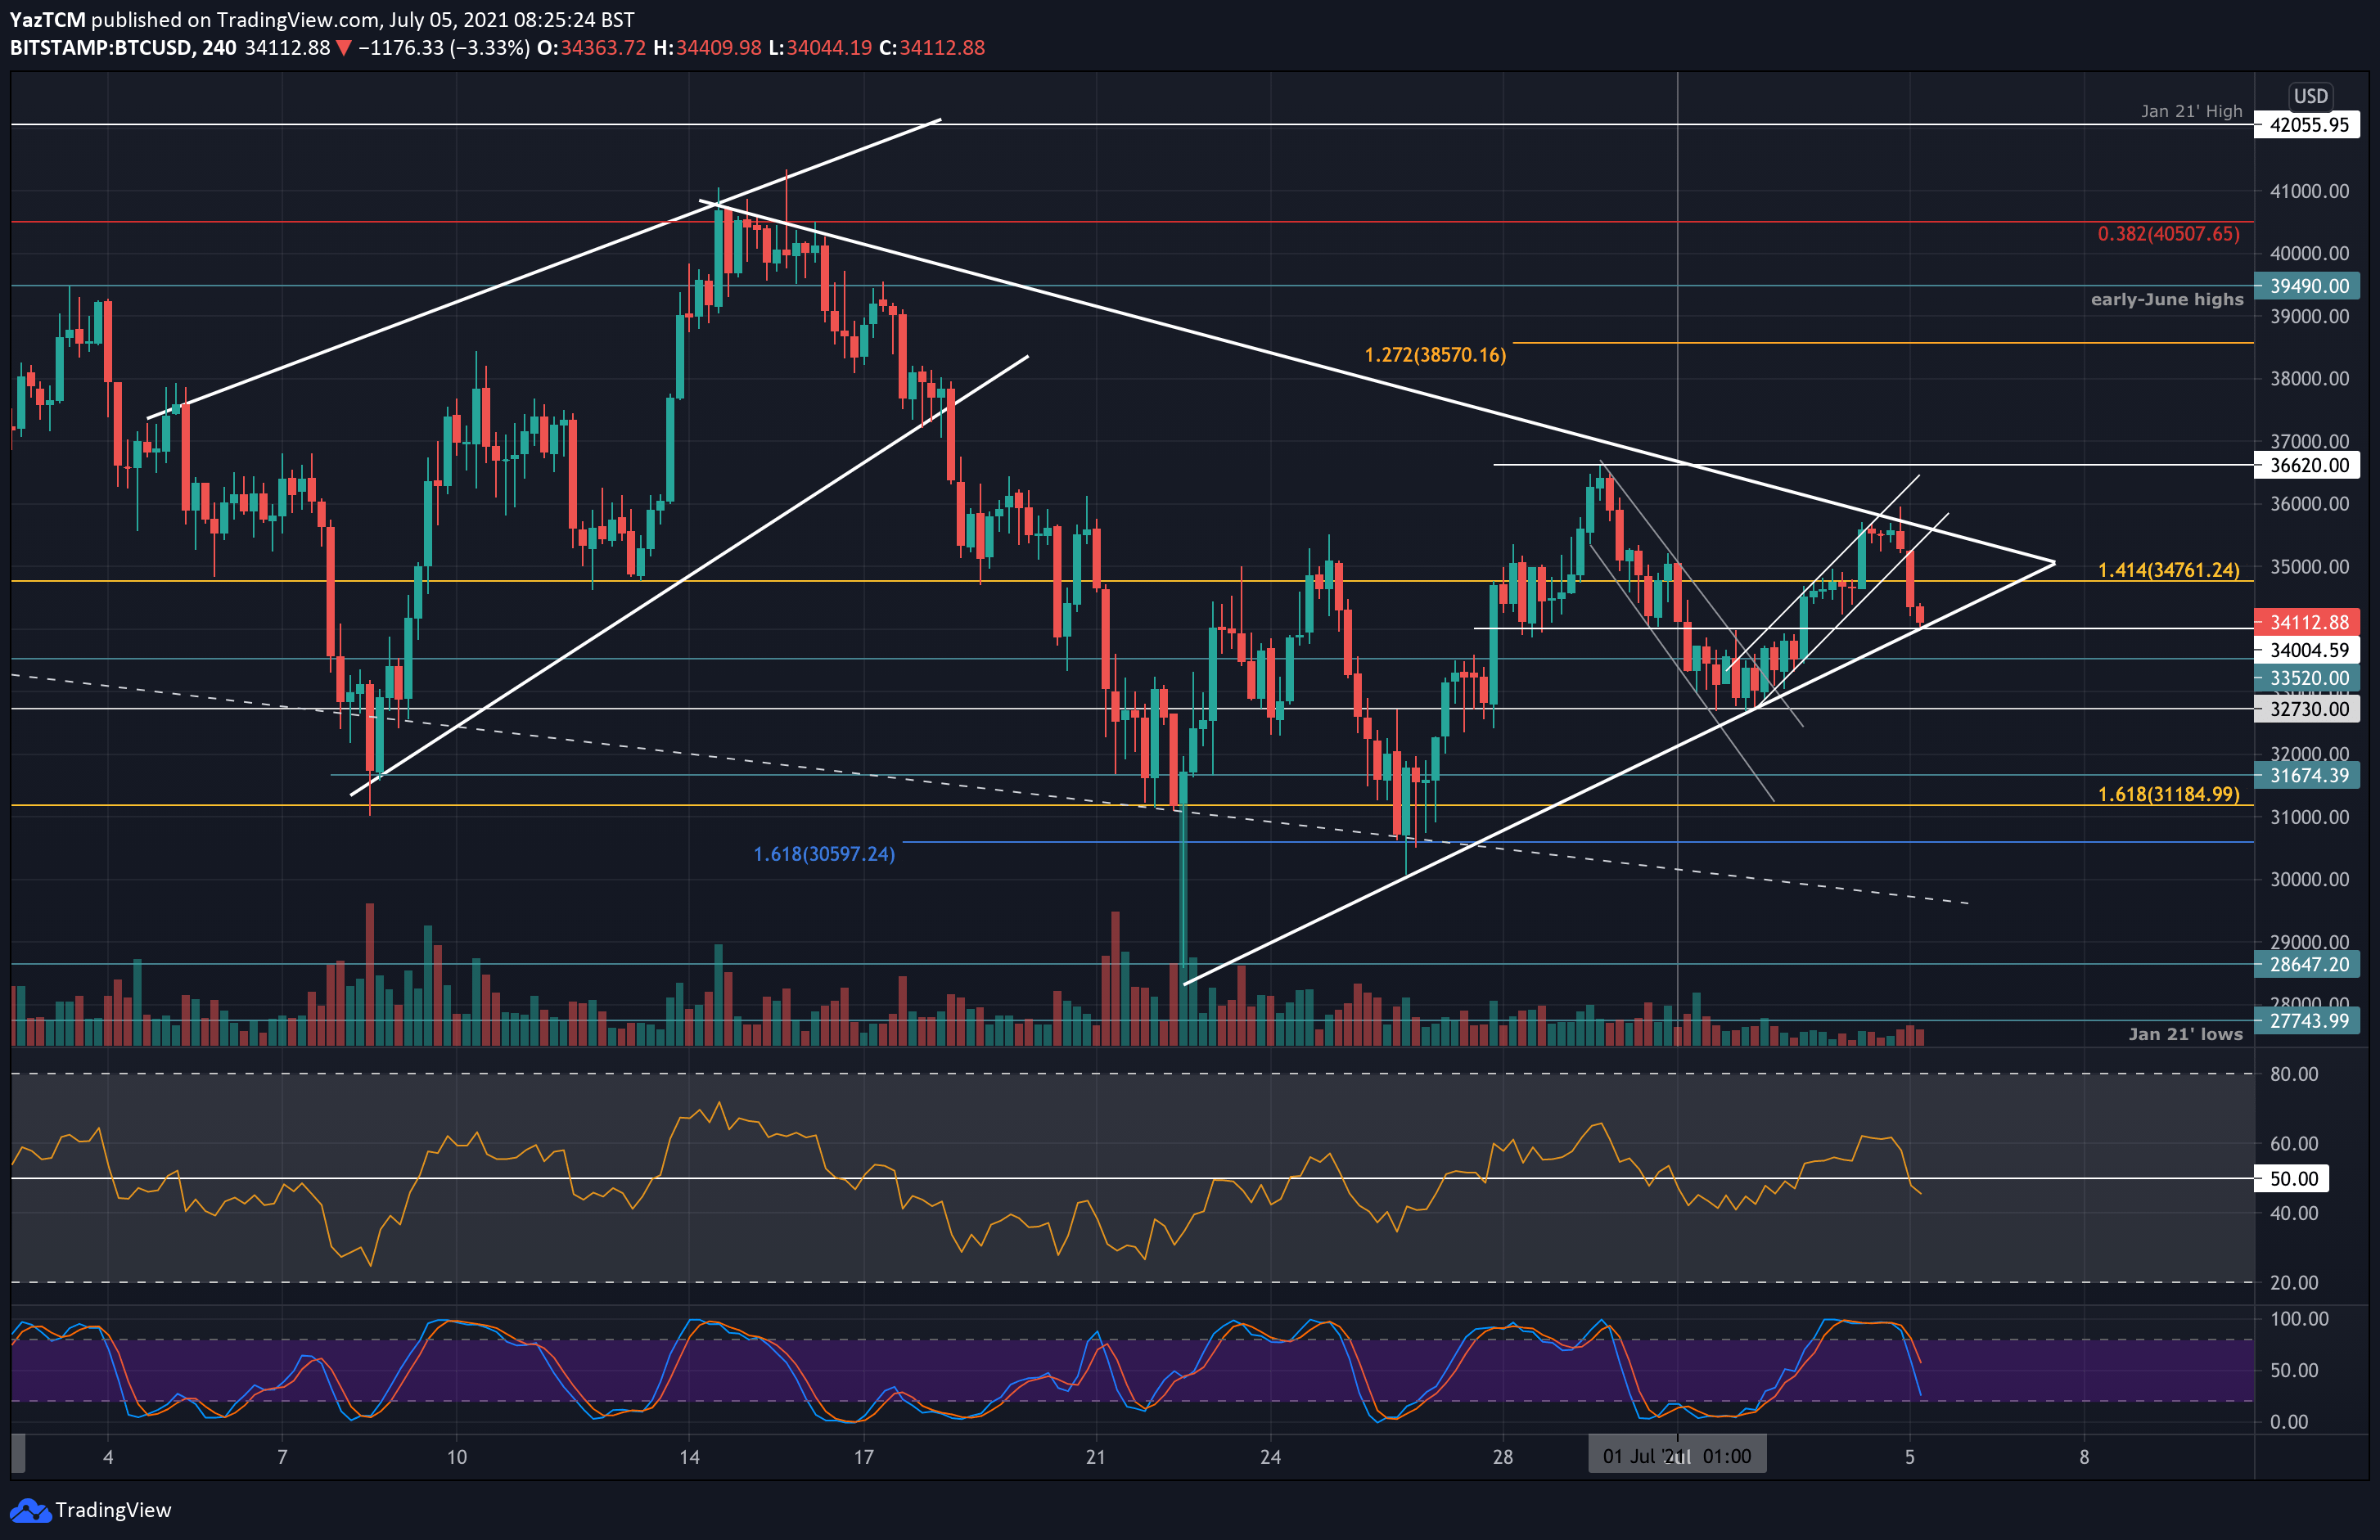
As can be seen below, on the short-term chart, the bitcoin price is now trading inside a perfect symmetrical triangle pattern – the rejection yesterday hit the upper boundary of the triangle (~$35.6K). As of writing these lines, bitcoin finds support on top of the lower angle, amid $34K. Any breakout is likely to pave the next direction for BTC in the short term.
Although tradeable patterns are emerging in the short term, on the longer timeframe, BTC continues to trade sideways between $30K and $42K. It must break this medium-term range to dictate the next overall direction for the market. By then, the trading volume is likely to return to the markets.
What’s Next? BTC Price Support and Resistance Levels to Watch
Key Support Levels: $34,000, $33,500, $32,700, $31,675, $31,185.
Key Resistance Levels: $34,570, $35,200 – $35,600, $36,375 – $36,620, $38,000.
The first support lies at the lower angle of the triangle at $34,000. Beneath the triangle, further support is followed at $33,500, $32,700 (early July support), $31,675, and $31,185 (downside 1.618 Fib Extension).
On the other side, the first resistance lies at $34,570 (20-day MA). This is followed by $35,200 (upper angle of the triangle) – $35,600 (weekly resistance), $36,375 (50-day MA) – $36,620, $38,000, $38,570 (1.272 Fib Extension), and $39,500.
Again, the daily RSI remains bearish beneath the long-term descending trendline as the bulls fail to establish any continued momentum.
Bitstamp BTC/USD Daily Chart

Bitstamp BTC/USD 4-Hour Chart