


Bitcoin is trading under $9,000 for the first time in February. The losses follow a series of unsuccessful attempts to sustain gains and movements above $10,000. Besides, the yearly highs at $10,500 might have marked the end of the week-after-week rally that saw Bitcoin price grow significantly from $7,000 at the beginning of January.
At the time of press, BTC/USD is trading slightly under $8,700. The freefall from levels above $9,000 failed to find support at $8,700. A weekly low has been formed at $8,530 with $8,500 support standing out after being tested.
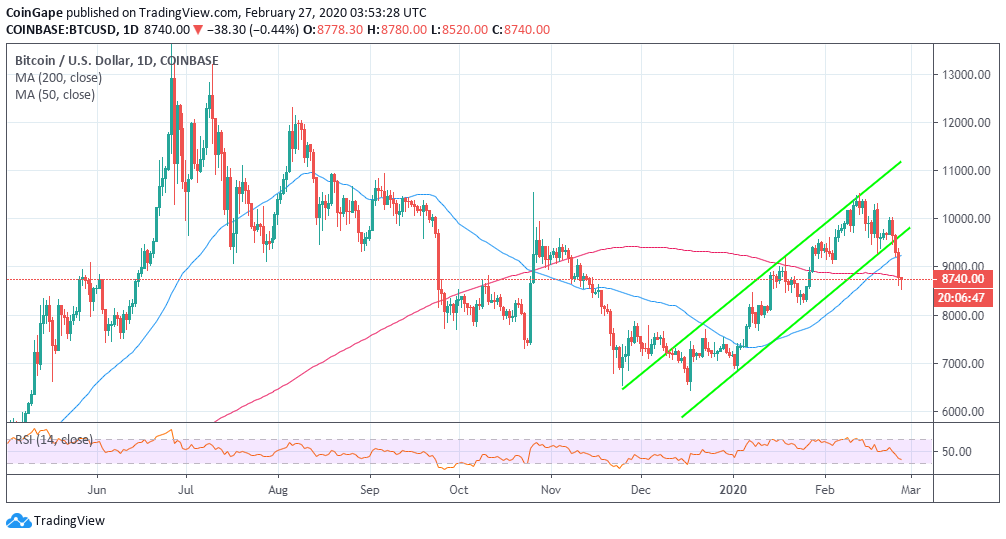
Bitcoin price is also exchanging hands below the 200-day SMA for the first time since the beginning of February. If BTC/USD does not reverse upwards and gain ground above the moving average, the sellers are likely to exert more pressure, forcing the bulls down a painful path towards $8,000.
BTC/USD daily chart
Looking at the daily chart, indicators clearly show that the buyers have little or no say in the direction the price takes, at least for now. The Relative Strength Index (RSI) continued downward movement from highs of 75 in February shows that ongoing losses will require a catalyst to stop.
To make things worse, the rejection of another Bitcoin exchange-traded fund (ETF) by the US Securities and Exchange Commission (SEC) has left a good number of investors demoralized. The ETF belonging to Wilshire Phoenix was filed in summer last year and has been rejected on grounds of not proving that Bitcoin is resistant to market manipulation.
Bitcoin Key Levels
Spot rate: $8,737
Relative change: -40
Percentage change: 0.47%
Trend: Bearish
Volatility: High
Support $8,600, $8,500 and $8,000
Resistance: $8,800, and $9,000