


The flagship cryptocurrency eventually broke out above the stubborn resistance at $11,000. The impressive weekend gains extended to $11,500. However, the tremendous bullish pressure appears to have taken a pit stop in the range between $11,200 and $11,500. Meanwhile, BTC/USD is teetering at $11,360 as bulls take a hiatus before resuming the final approach to highs $12,000.
The symmetrical triangle pattern explored on Friday gave the bulls the boost the needed. This triangle pattern illustrates consolidating prices with one trendline connecting the lower highs and another the higher highs. The trendlines tend to merge at some point, but a breakout occurs before the price hits the tip of the triangle.
BTC/USD 4-hour chart
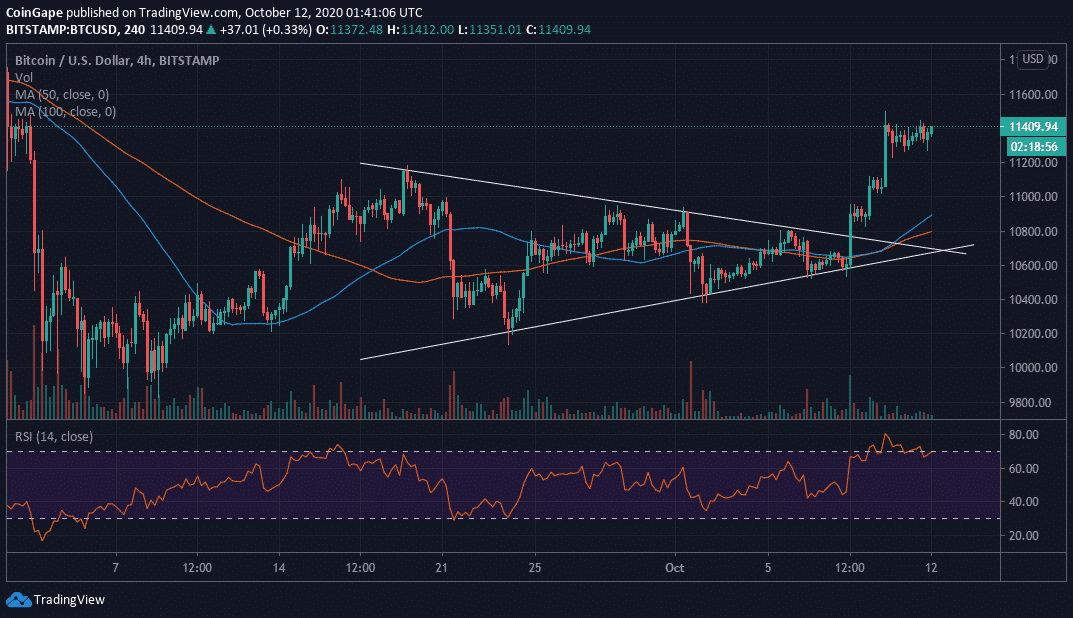
Despite bullish action stalling at $11,500, Bitcoin appears to be nurturing an uptrend according to the Relative Strength Index. Another approached at $11,500 could result in a breakout, sending Bitcoin to $12,000.
IntoTheBlock IOMAP model highlights decreasing resistance for the bellwether cryptocurrency. In other words, Bitcoin is likely to close the remaining gap towards $12,000. In the meantime, the hurdle at $11,393 – $11,722 must come out of the way. The seller congestion in this zone is brought about by the 1 million addresses that previously bought 648,000 BTC. Gains above this range pave the way for the ultimate rally beyond $12,000.
On the flip side, BTC/USD is sitting on an area with immense support. Therefore, it is doubtful that a significant reversal will take place in the near term. The primary support holds in the range between $10,370 and $10,712. Here, 1.8 million addresses previously purchased 1.2 million BTC.
Bitcoin Intraday Levels
Spot rate: $11,400
Relative change: 30
Percentage change: 0.26%
Trend: Bullish
Volatility: Low
