Development activity on the Chainlink network is on the rise once again. This is according to an analysis shared by the team at Santiment who also pointed out that the current level of development activity, is climbing back to levels last seen when Chainlink posted its most recent all-time high of $52.88.
The team at Santiment shared their observation through the following statement and accompanying chart.
Chainlink is climbing in terms of its raw amount of notable daily github submissions. Our LINK development activity metric is climbing back toward its All Time High rate that was made 4 days before the price All Time High of $52.88 on May 9th.
Chainlink (LINK) Might Have Printed a Double Bottom
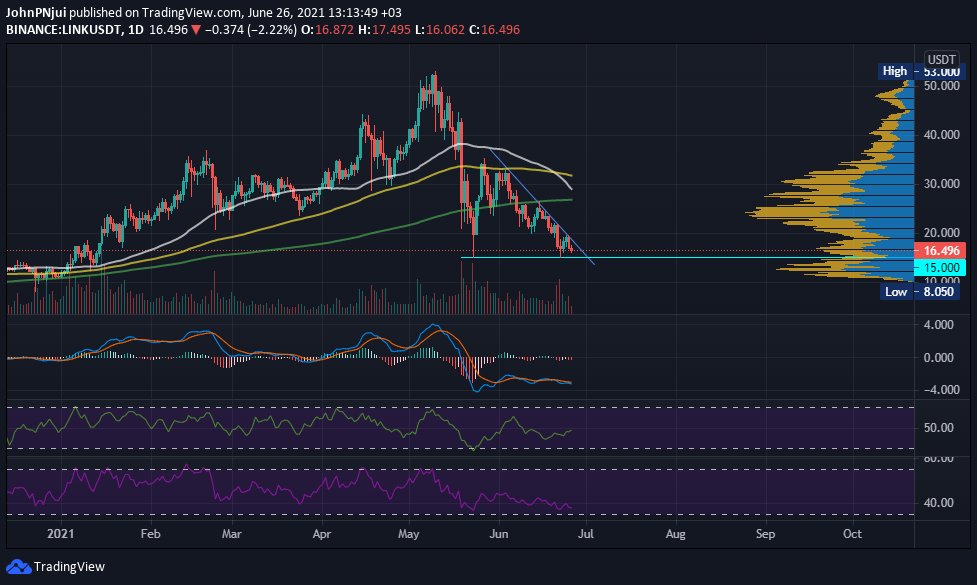
With respect to price action, Chainlink (LINK) is trading at $16.496 after a local low of $16 earlier today. With the latter price level, Chainlink might have printed a double bottom with the low of $15 experienced on the 22nd of this month.
To note is that Chainlink bounced at the same $15 price area on the 23rd of May, thus printing a very steep descending triangle pattern as seen in the following daily LINK/USDT chart.

In the scenario the aforementioned double bottom pattern plays out, Chainlink might just have enough fuel to escape from the jaws of the descending triangle that points to lower levels.
However, a death cross is on the horizon for Chainlink with the 50-day moving average (white) about to cross the 200-day moving average (green) in the first week of July.
Therefore, a wait-and-see approach is advised when trading Chainlink. A resolution of the descending triangle and the passing of the death cross will provide clarity on Chainlink’s next course of action in the crypto markets.


